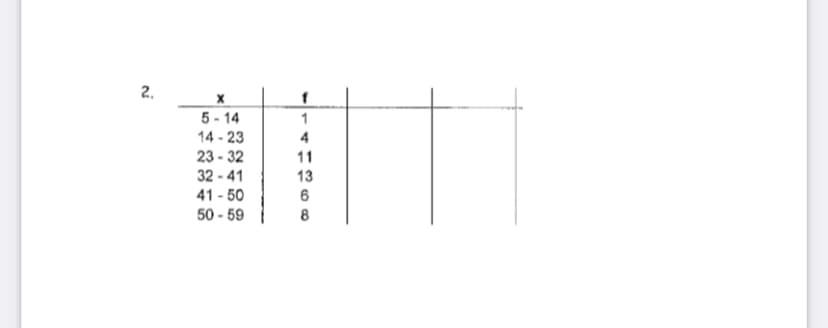
Find the mean, variance, and standard deviation for each set of data


Q: FInd the: Mean, Median, Mode, IQR, Variance, Standard Deviation, and Absolute Deviation
A: Mean is the average value around which the whole data set is concentrated. For the set of 'n'…
Q: A set of data consists of 38 observations. How many classes would you recommend for the frequency…
A:
Q: Find the mean and median
A: Note: Here we are solving problem 12) with the parts a), b), and c) For the reaming problem please…
Q: The collection, organization, and analysis of data is called statistics.
A:
Q: a. The mean is The median is
A: mean= sum of all observation/number of observations. mode =most occurring value in the data set.…
Q: If the mean of a symmetrical distribution is 130, which of these values could be the median of the…
A:
Q: The question is which box plot has the greatest variability and which box plot has the least…
A: Basics of a boxplot:A boxplot is based on the 5-number summary: (Minimum, Q1, Median, Q3, Maximum);…
Q: Use the display of data to find the mean, median, mode, and midrange. (Round to the nearest tenth as…
A:
Q: Identify each data as either nominal, ordinal, ratio or interval. Social Security System (SSS)…
A: Nominal and Ordinal both tare categorical (qualitative) variables having no numerical significance.…
Q: Identify each data as either nominal, ordinal, ratio or interval. Social Security System (SSS)…
A: Given to classify each data as either nominal, ordinal, ratio or interval. Social Security System…
Q: A data set consists of 83 observations. How many classes would you recommend for a frequency…
A: Selection of number of classes:“2 to the k rule” suggests that the number of classes is the smallest…
Q: find the mean, median, and mode Q1, Q3, D6 and P58 of the following data
A: As per our guidelines we are suppose to answer one question and three sub parts.
Q: Draw a stem-and-leaf plot for each data set. 6) Minutes to Run 5km 45.1 30.3 18.4 21.9 35.9 29.1 32…
A: to draw a stem and leaf diagram for the data
Q: find the range, mean, variance, and standard deviation of the sample data set.
A:
Q: Find the mean, median, 1st quartile, mode, variance, and range for the following data:…
A: Enter the given data in Excel as follows:
Q: Answer the statistical measures and create a box and whiskers plot for the following set of data.
A: Given data: 3,3,7,9,11,11,15,18,19,19
Q: In the ordered data : 20 , a , 25,30,40 , b , 50 if the mean is 34 , and the first quartile is 24 ,…
A: Given data; ordered data : 20 , a ,25,30,40 , b ,50 mean = 34 , first quartile(Q1) = 2 Number of…
Q: Given the data set, show how the variance and z-score of each grade is found.
A: Variance is the measure of dispersion. It provide the deviation of data set from the mean. It is…
Q: Find the mean, variance, standard deviation, zscore of each variable.
A:
Q: Q2/A- Find the arithmetic mean, median and mode for the following data:
A: Here given total 10 data values Mean is average of data values Median is average of two middle most…
Q: Find (a) the range and (b) the standard deviation of the set of data. 62, 47, 41, 56, 47, 44, 53
A: We'll answer the first question since the exact one wasn't specified. Please submit a new question…
Q: Find the mean and median for the grouped data.
A: The mean and median are the types of average. Mean is the mathematical average and median is the…
Q: Fill in the following blank with either the word within or between: The arrows are pointing to which…
A: The arrows are pointing to which type of variance in the data:
Q: The deviation of an entry x in a population data set is the difference between the entry and the…
A: Note: Hi there! Thank you for posting the question. It is considered that the deviation is taken…
Q: Find the scores one, two, and three standard deviations above and below the mean, given the…
A: Note: Hi, thank you for the question. As per our company guideline we are supposed to answer only…
Q: Pick any 10 two-digit number of your choice and calculate the mean, variance, IQR, and range of any…
A: Let the sample be 28, 21, 22, 28, 34, 26, 57, 48, 35, 31 Sample arranged in ascending order: 21,…
Q: Find the Lower Quartile, Median, and Upper Quartile for the following data. Data X : 1, 3, 6,…
A: Given data is1,3,6,8,10,11,13,17sample size(n)=8the given data is already arranged in ascending…
Q: b) Find the Mean, Median, Mode, Standard Deviation, Range, and IQR of the age data. Mean: Median:…
A: The following data is given: Sex weight Age Male 12 11 Female 9 2 Female 8 12 Male 10 15…
Q: Draw a histogram for each data set.
A: Data set of life expectancy is given, State Years Maryland 81 Virginia 82.5…
Q: The mean is another term for the ________ value of a data set.
A: Given, The mean is another term for the ________ value of a data set.
Q: a. Find the median, first quartile, and third quartile. b. Find the 26th and 83rd percentiles. c.…
A: Given: 59.2 83.7 100.2 59.5 85.6 100.7 61.6 85.8 65.5 86.6 66.6 87…
Q: Find the mean and median to revenue
A: These mean and median are summary statistics
Q: onsider a data set: 1, 2, 5, 6, 7, 6. Find the range, variance, and standard deviation for this data…
A: the given data is x=1, 2, 5, 6, 7, 6
Q: Find the scores one, two, and three standard deviations above and below the mean, given the…
A: Given that μ = 86.1 , σ = 12.5 Find the score
Q: Determine the mean, median, standard deviation, and interquartile range for each data set. Then, use…
A: Introduction: Mean : For the ungrouped data , the sample mean and sample variance can be defined…
Q: Given the data set {50, 5, 12, 13, 15,18, 22, 6} Determine the 75th percentile.
A: Ans#- Given data set { 50, 5, 12, 13, 15, 18, 22, 6} Determine the 75th…
Q: Data Points frequency 1.2 4.8 8 8.4 30 12.0 15.6 3
A:
Q: Find the mean of the data set 18, 36, 24, 36, 30, and 36.
A: Mean of data set is the avarage of the values in a data set. It is the ratio of total number of…
Q: Find the mean, variance, and standard deviation for each set of data. 南打|| 3-8 1 8 - 13 13 - 18 18 -…
A:
Q: The ages for a sample of fans at a concert are listed. Whats the mean, median, mode, range,…
A: The mean of a data set is commonly known as the average. You find the mean by taking the sum of all…
Q: Determine the mean, E(X), and variance, V(X). Ro
A:
Q: the questionnaire. For this set of data, find: 1.) the mean, 2.) the median and 3.) the mode.…
A: Here we have sorted data in ascending order: x Frequency (f) f⋅x cf 2 12 24 12 3 20 60 32 4…
Q: Find the mean, variance, and standard deviation for each set of data. 南計| 1. 3-8 1 8- 13 19 2 13 -…
A: We have to find the mean, variance, standard deviation.
Q: Rank the data sets described in order of the least spread out (1) to the most spread out (5) based…
A:
Q: 20 14 41 34 253 14 15 28 33 24 401 34 42 33
A: Solution: 6. The given data is 20, 14, 41, 34, 253, 14, 15, 28, 33, 24, 401, 34, 42 and 33.
Q: Find the first and second quartile, median, and the interquartile range.
A: To find the first and second quartile, median, and the interquartile range of the given data.
Q: Find the mean, median, and mode for each set of values.
A:
Q: find the mean, median, mode, range, Varian ce sof and Standard deviation for the following data set…
A:
Q: The owner of a small company employs 6 people. As part of their personnel file, she asked each one…
A:
Q: For each set of data, compute the mean, median an 1. 20, 22, 27, 18, 20, 21, 21, 25, 16, 28, 30
A: 1) Given that data. 20, 22, 27, 18, 20, 21, 21, 25, 16, 28, 30 First Arrange data in ascending…


Trending now
This is a popular solution!

Step by step
Solved in 2 steps with 1 images

