Find the proportion of women who are between 61 and 67 inches tall. e proportion of women who are between 61 and 67 inches tall is .
Find the proportion of women who are between 61 and 67 inches tall. e proportion of women who are between 61 and 67 inches tall is .

Glencoe Algebra 1, Student Edition, 9780079039897, 0079039898, 2018
18th Edition
ISBN:9780079039897
Author:Carter
Publisher:Carter
Chapter10: Statistics
Section: Chapter Questions
Problem 22SGR

Related questions
Question
I need help with part 3, and an explanation please
Transcribed Image Text:rt: 2/3
rt 3 of 3
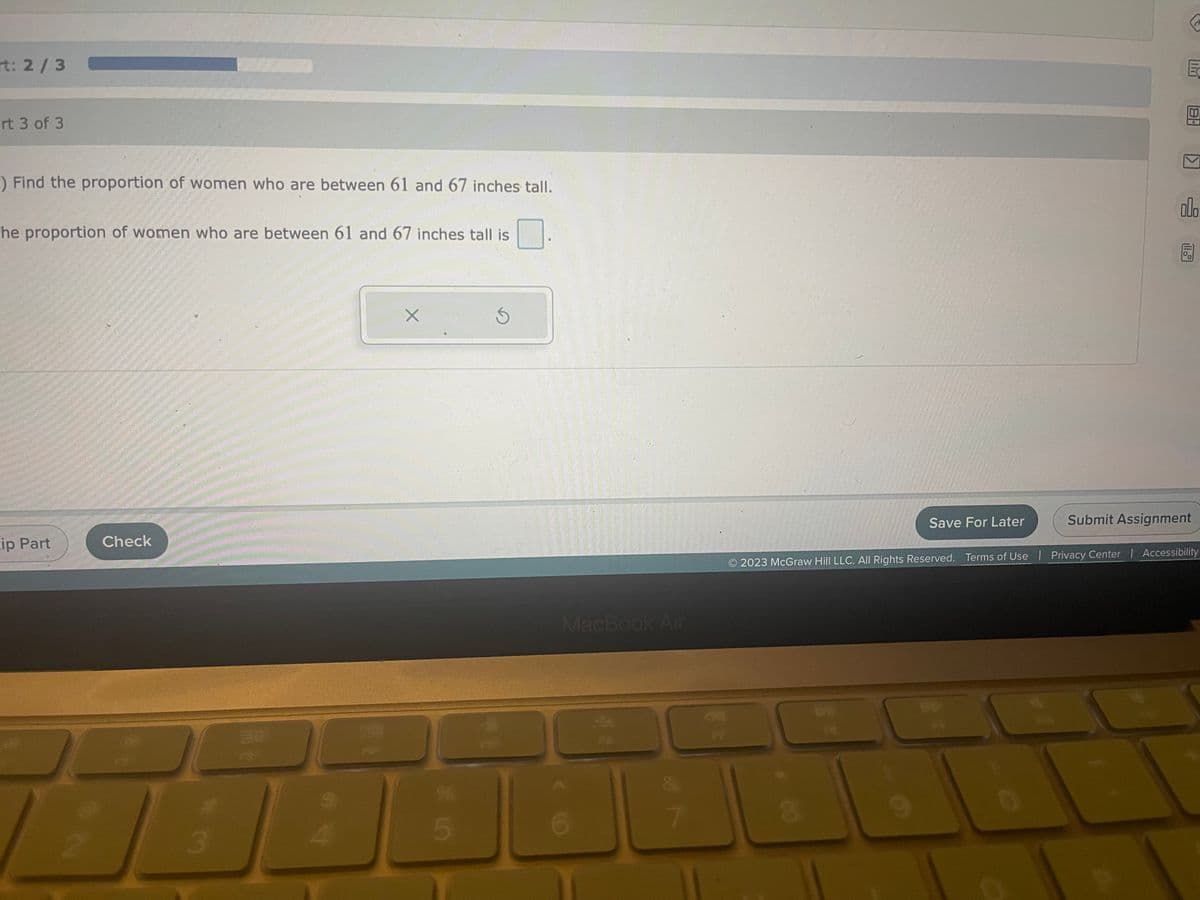
:) Find the proportion of women who are between 61 and 67 inches tall.
The proportion of women who are between 61 and 67 inches tall is
ip Part
Check
He
24
3
888
X
* 10
5
S
MacBook Air
6
FO
8
Save For Later
9
E
O
K
2023 McGraw Hill LLC. All Rights Reserved. Terms of Use | Privacy Center | Accessibility
000
A
Submit Assignment
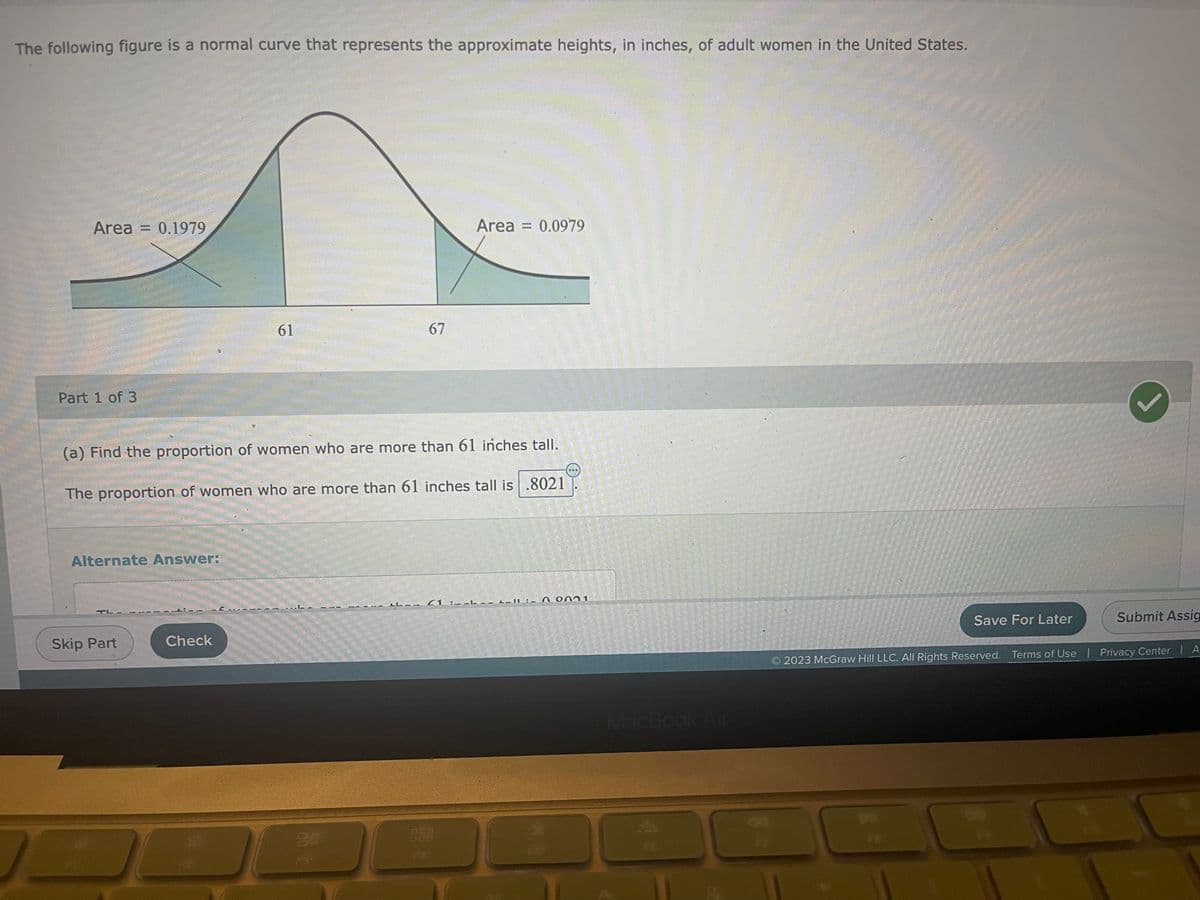
Transcribed Image Text:The following figure is a normal curve that represents the approximate heights, in inches, of adult women in the United States.
Area = 0.1979
Part 1 of 3
Alternate Answer:
TL-
(a) Find the proportion of women who are more than 61 inches tall.
The proportion of women who are more than 61 inches tall is .8021
Skip Part
61
Check
L
67
20
Area = 0.0979
LL-- (1 :-
2_11:_ 0001
MacBook Air
Save For Later
Submit Assig
2023 McGraw Hill LLC. All Rights Reserved. Terms of Use | Privacy Center | A
Expert Solution
This question has been solved!
Explore an expertly crafted, step-by-step solution for a thorough understanding of key concepts.

This is a popular solution!

Trending now
This is a popular solution!

Step by step
Solved in 3 steps

Recommended textbooks for you
Glencoe Algebra 1, Student Edition, 9780079039897…
Algebra
ISBN:
9780079039897
Author:
Carter
Publisher:
McGraw Hill

Glencoe Algebra 1, Student Edition, 9780079039897…
Algebra
ISBN:
9780079039897
Author:
Carter
Publisher:
McGraw Hill