Find the range, variance, and standard deviation for the given sample data, if possible. If the measures of variation can be obtained for these values, do the results make sense? Biologists conducted experiments to determine whether a deficiency of carbon dioxide in the soil affects the phenotypes of peas. Listed below are the phenotype codes, where 1= smooth-yellow, 2= smooth-green, 3=wrinkled yellow, and 4 = wrinkled-green. 2 132 3 2 4 2 2 2 2 3 2 2 2 2 2 2 2 20 He iainye ui uie salipie udld i5 . (Type an integer or a decimal. Do not round.) O B. The range of the sample data cannot be calculated. Can the standard deviation of the sample data be obtained for these values? Choose the correct answer below and, if necessary, fill in the answer box within your choice. O A. The standard deviation of the sample data is 0.6. (Round to one decimal place as needed.) O B. The standard deviation of the sample data cannot be calculated. Can the variance of the sample data be obtained for these values? Choose the correct answer below and, if necessary, fill in the answer box within your choice. O A. The variance of the sample data is. (Round to one decimal place as needed. O B. The variance of the sample data cannot be calculated.
Find the range, variance, and standard deviation for the given sample data, if possible. If the measures of variation can be obtained for these values, do the results make sense? Biologists conducted experiments to determine whether a deficiency of carbon dioxide in the soil affects the phenotypes of peas. Listed below are the phenotype codes, where 1= smooth-yellow, 2= smooth-green, 3=wrinkled yellow, and 4 = wrinkled-green. 2 132 3 2 4 2 2 2 2 3 2 2 2 2 2 2 2 20 He iainye ui uie salipie udld i5 . (Type an integer or a decimal. Do not round.) O B. The range of the sample data cannot be calculated. Can the standard deviation of the sample data be obtained for these values? Choose the correct answer below and, if necessary, fill in the answer box within your choice. O A. The standard deviation of the sample data is 0.6. (Round to one decimal place as needed.) O B. The standard deviation of the sample data cannot be calculated. Can the variance of the sample data be obtained for these values? Choose the correct answer below and, if necessary, fill in the answer box within your choice. O A. The variance of the sample data is. (Round to one decimal place as needed. O B. The variance of the sample data cannot be calculated.

Glencoe Algebra 1, Student Edition, 9780079039897, 0079039898, 2018
18th Edition
ISBN:9780079039897
Author:Carter
Publisher:Carter
Chapter10: Statistics
Section10.4: Distributions Of Data
Problem 19PFA

Related questions
Question
Please answer those two questions, thanks
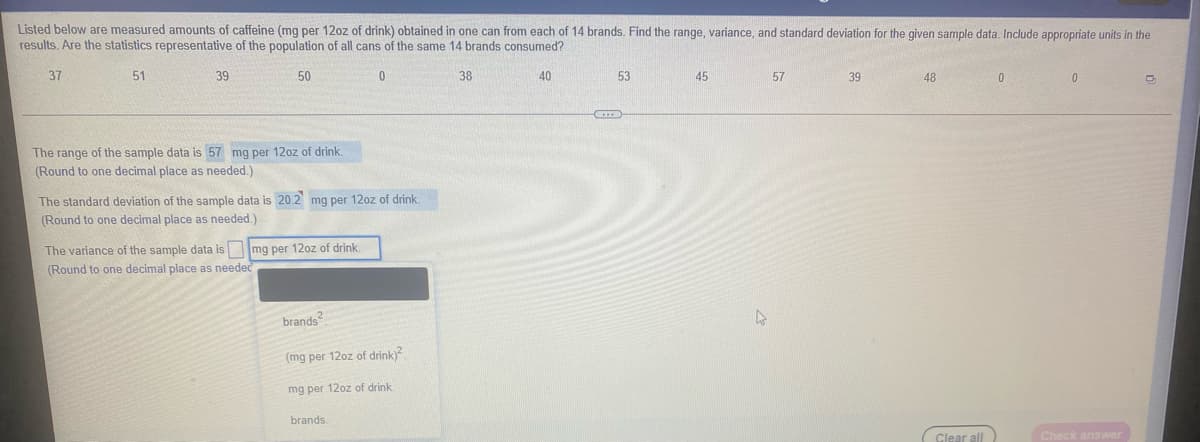
Transcribed Image Text:Listed below are measured amounts of caffeine (mg per 12oz of drink) obtained in one can from each of 14 brands. Find the range, variance, and standard deviation for the given sample data. Include appropriate units in the
results. Are the statistics representative of the population of all cans of the same 14 brands consumed?
37
51
39
50
38
40
53
45
57
39
48
The range of the sample data is 57 mg per 12oz of drink.
(Round to one decimal place as needed.)
The standard deviation of the sample data is 20.2 mg per 12oz of drink.
(Round to one decimal place as needed.)
The variance of the sample data is mg per 12oz of drink.
(Round to one decimal place as needec
brands
(mg per 12oz of drink)
mg per 12oz of drink.
brands
Clear all
Check answer
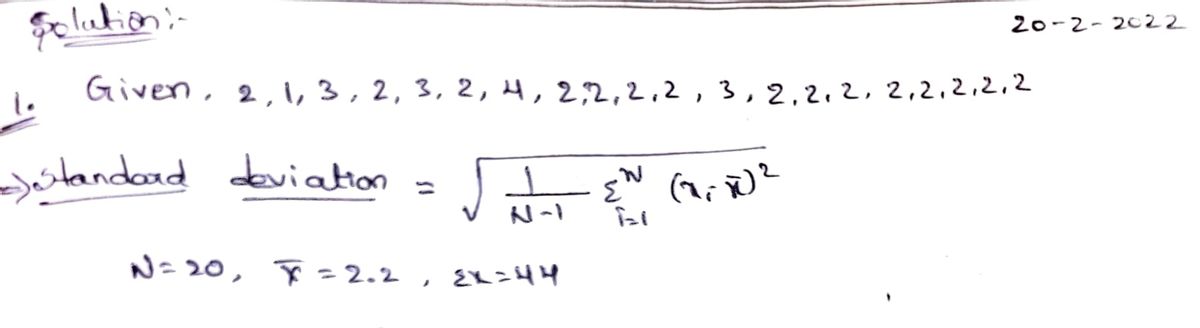
Transcribed Image Text:Find the range, variance, and standard deviation for the given sample data, if possible. If the measures of variation can be obtained for these values, do the results make sense?
Biologists conducted experiments to determine whether a deficiency of carbon dioxide in the soil affects the phenotypes of peas. Listed below are the phenotype codes, where 1=smooth-yellow, 2= smooth-green, 3=wrinkled
yellow, and 4= wrinkled-green.
2 1 3 2 3 2 4 2 2 2 2 3 2 2 2 2 2 2 2 2 P
1me idnye ui uie sdilipie udla is 3.
(Type an integer or a decimal. Do not round.)
O B. The range of the sample data cannot be calculated.
Can the standard deviation of the sample data be obtained for these values? Choose the correct answer below and, if necessary, fill in the answer box within your choice.
O A. The standard deviation of the sample data is 0.6.
(Round to one decimal place as needed.)
O B. The standard deviation of the sample data cannot be calculated.
Can the variance of the sample data be obtained for these values? Choose the correct answer below and, if necessary, fill in the answer box within your choice.
O A. The variance of the sample data is.
(Round to one decimal place as needed.
O B. The variance of the sample data cannot be calculated.
Expert Solution
Step 1

Trending now
This is a popular solution!

Step by step
Solved in 3 steps with 3 images

Recommended textbooks for you
Glencoe Algebra 1, Student Edition, 9780079039897…
Algebra
ISBN:
9780079039897
Author:
Carter
Publisher:
McGraw Hill
Glencoe Algebra 1, Student Edition, 9780079039897…
Algebra
ISBN:
9780079039897
Author:
Carter
Publisher:
McGraw Hill