Find the sample variances of the data sets A and B given below. A:3, 4, 6, 7, 10 B:-20, 5, 15, 24
Find the sample variances of the data sets A and B given below. A:3, 4, 6, 7, 10 B:-20, 5, 15, 24

Glencoe Algebra 1, Student Edition, 9780079039897, 0079039898, 2018
18th Edition
ISBN:9780079039897
Author:Carter
Publisher:Carter
Chapter10: Statistics
Section10.5: Comparing Sets Of Data
Problem 1GP

Related questions
Question
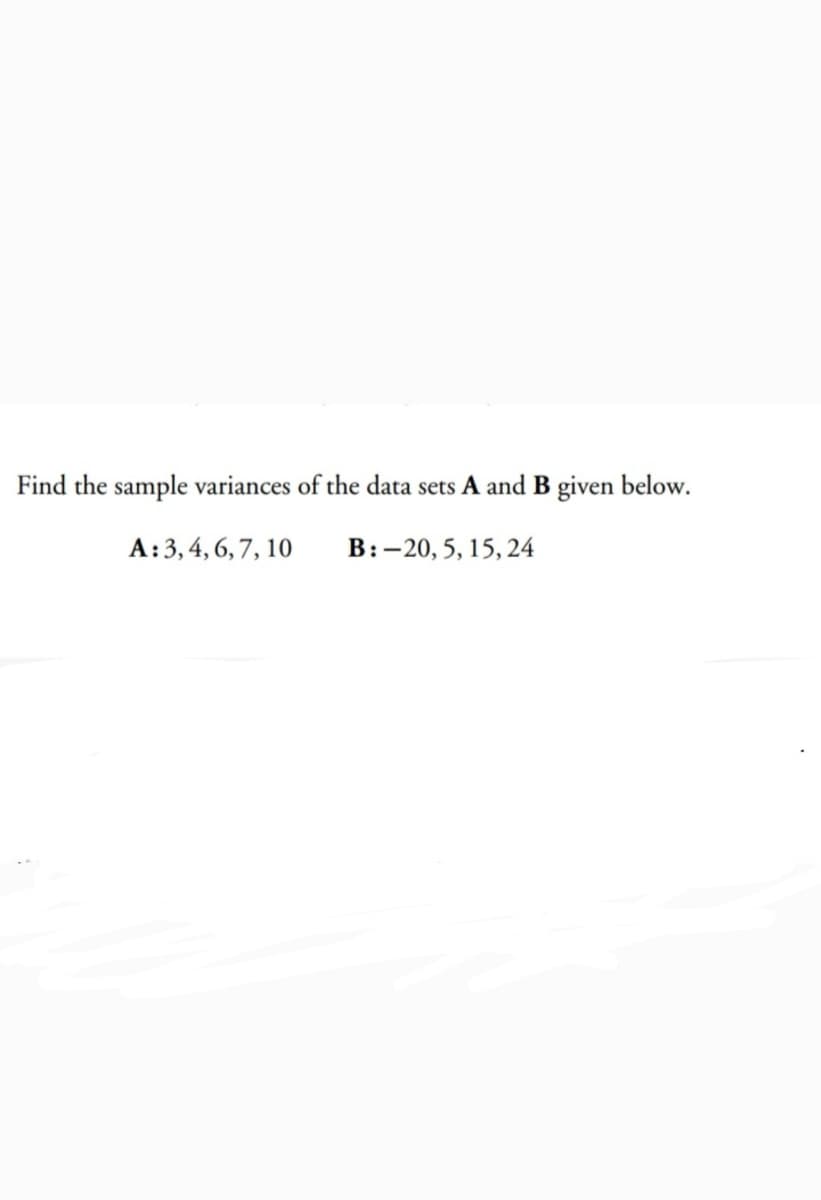
Transcribed Image Text:Find the sample variances of the data sets A and B given below.
A:3, 4, 6,7, 10
B:-20, 5, 15, 24
Expert Solution
This question has been solved!
Explore an expertly crafted, step-by-step solution for a thorough understanding of key concepts.

This is a popular solution!

Trending now
This is a popular solution!

Step by step
Solved in 2 steps with 2 images

Recommended textbooks for you
Glencoe Algebra 1, Student Edition, 9780079039897…
Algebra
ISBN:
9780079039897
Author:
Carter
Publisher:
McGraw Hill

Glencoe Algebra 1, Student Edition, 9780079039897…
Algebra
ISBN:
9780079039897
Author:
Carter
Publisher:
McGraw Hill