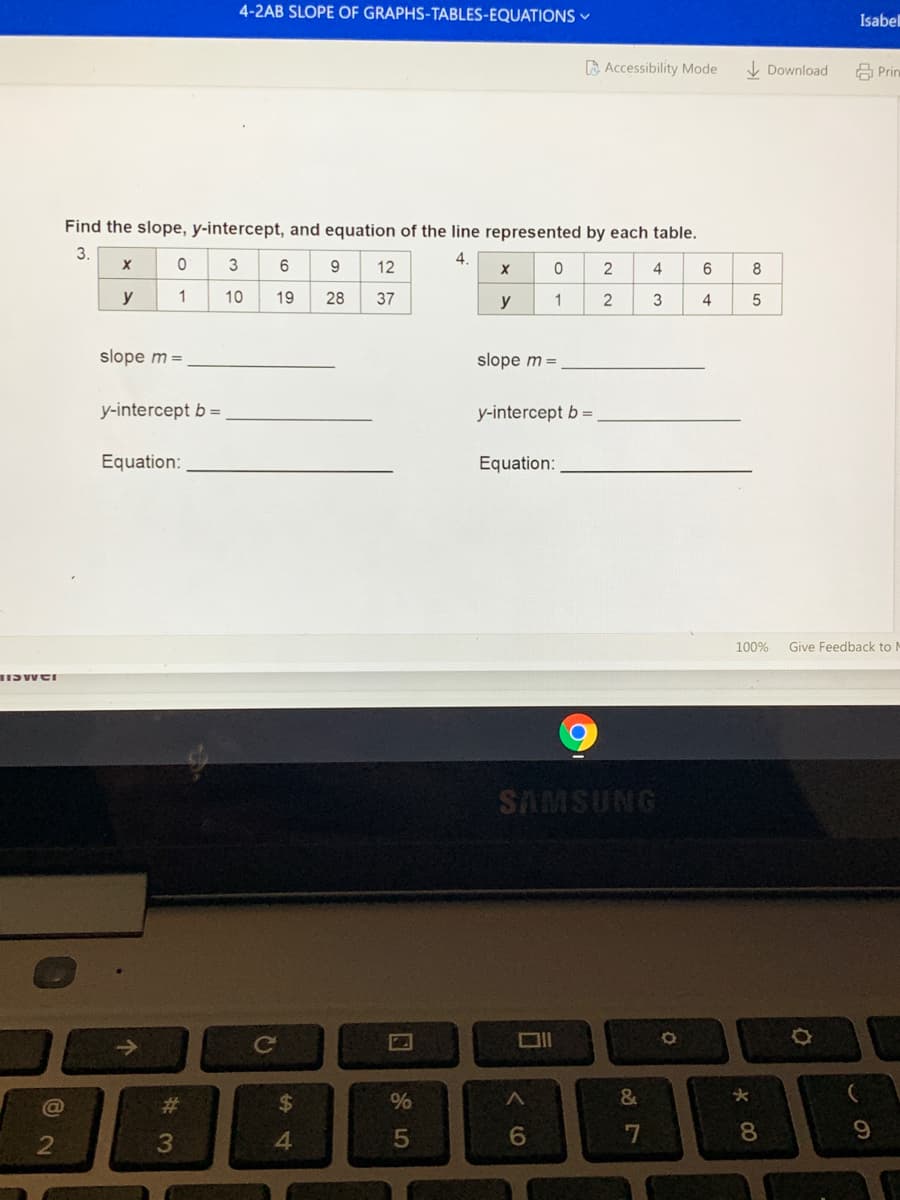
Find the slope, y-intercept, and equation of the line represented by each table. 3. 4. 3 6 12 4 8 y 1 10 19 28 37 y 1 2 3 slope m = slope m = y-intercept b = y-intercept b = Equation: Equation:
Q: Find the slope of the line represented by the data below. X-3 -2 -1 y| 12 8 4 0 -4 Simplify…
A: slope =?
Q: Find the slope andy-intercept of the line represented by the table. 1 4 y 11 19 27 35 The slope is m…
A:
Q: Exercises 39–42: Decide whether a line can pass through the data points. If it can, determine the…
A: 41) Take any two point from given table As (1,1) & (3,4) So equation of line passes above…
Q: (-6,1); m = 7 Write an equation in point slope form of the line that passes through the given…
A: Given:slope m=7x1,y1=-6 ,1Equation of a line:y-y1=mx-x1
Q: Is there a linear relationship between the distance of a house from a fire station and the fire…
A: 2a. The value of r(correlation) between X and Y is 0.96098 and it is calculated by Excel function,…
Q: ty 90 80 70 60 S 50 40 30 20 10 0 1 2 3 4 5 678 Days Since Arrival Use the points (1, 95) and (6,…
A: We know that the slope-intercept form of a line is : y = mx + c ; Here y is no. of pairs of shoes in…
Q: Find the slope of the line represented by the data below. 2 y| 15 9 3 -3 -9 4 8 Simplify completely.…
A: slope =change in y /change in x
Q: 50 45 40 35 30 25 20 15 10 5. elo be 9 10 12 3 45 7 8 Hours 1. Name a point using coordinate pairs.…
A:
Q: The lines shown below are parallel. If the green line has a slope of what is the slope of the red…
A: This question is related to slope of parallel lines, we will solve it using given information.
Q: ketch the line with slope (5)/(4) that passes through the point (−2, 1).
A: Given that: Slope of the line =54 and the line passes through (-2,1).
Q: Given the line below. 4 3 (1, 2) 23 4 5 s 4 3 2 (-1, -2)/² Write the equation of the line, in…
A: First of all we will locate two points on the line. Then we will find the slope for the line. After…
Q: 1. Determine the slope of the line between the two given coordinates. Write the slope as a reduced…
A: As this is of the type multiple sub-part, according to the Bartleby answering rule only first three…
Q: you are given one point on a line and the slope of the line. Find the coordinates of three other…
A: Given:The point on the line is P(x1, y1)=(2, 5) and slope m=12
Q: 4.) (4, -6) (4, 6)
A: Explanation of the answer is as follows
Q: 3. a) For each scatter plot, describe the relationship between x and y. b) Would you model each…
A:
Q: 7. To attend the state fair, they charge $6.00 for admission and $1 for each ride. If x- represents…
A: On solving ,we get
Q: The table shows the heights y (in centimeters) of a plant after x weeks. Use the table to complete…
A:
Q: 5. Write the slope intercept equation for each given line. You may [H) 4 B. 21 need to draw the line…
A: Given: a)AB↔ From the above graph coordinates A =(0,-3) ,B=(3,3) Slope intercept line form…
Q: Find the equation of the linear relationship. 120 110 100 90 70 60 50 40 30 20 10 O 10 20 30 40 50…
A: The equation passes through two points 30,90 and 40,60. x1=30, y1=90x2=40, y2=60 The equation of…
Q: Find an equation of the line with the given y-intercept and slope m. 1.) 5, m=4 2.) 1.5, m = -2.3
A: Here we have to find an equation of line with given y-intercept and slope m.
Q: Line g is shown on the graph below. y (5,7) C0, 6) -6-5-4-3-2-10 123 4 5 6 7 What is the slope of…
A: We will calculate slope using both points and line
Q: 9. Find the slope of a line passing through given points and show the coordinates. a. (2, 1) and…
A: Authoring guidelines: As per the authoring guidelines, we can solve only the first three parts of…
Q: Exercises 39–42: Decide whether a line can pass through the data points. If it can, determine the…
A: We know the equation line. that is y=mx+c. where, m is the slope of the line, c is the y-intercept.
Q: Consider the dataset belew Y 8 6. 6. 4 C. Find the value of r: d. Find the value of slope: e. Find…
A: Given,
Q: 8. The linear model for some butterfly data is given by the equation y = 0.238x + 4.642. Which of…
A: The general equation of a line is y=mx +c Where m is the slope and c is a constant. Now, the given…
Q: 12 What is the slope of any line perpendicular to this line? 13 The slope of a line is 1 12 12 13 13…
A:
Q: 3) Find the slope of each line given. Then determine if the lines are parallel or not. m,= 10.2) m,=…
A:
Q: 5.) m = (2,-6)
A:
Q: ŞB: Write an equation for each line with the given description. Leave answer in standard form. 1.…
A: In algebra, an equation can be defined as a mathematical statement consisting of an equal symbol…
Q: Identify the equation that represents the line c y 16 5. 4. 1 2 3 4 5 6 7 8
A: Given: Scatter plot
Q: What is the slope of the line shown? 10 -10 2. 10 |-10| 3. 3 1/2
A:
Q: Recommendations Skill plans Math LA Language arts Social studies Commor Eighth grade Y.3 Find a…
A:
Q: 1. Use the slope formula to determine the slope of the line between the two given points. a) (9,5),…
A:
Q: The scatter plot above depicts the relationship between a elevation measured in Meters (m) and…
A: Given: The scatter plot is shown as The equation of the line of best fit is C=22.5-1160m Elevation…
Q: In Exercises 37 and 38, find the value of x or y for which the line through A and B has the given…
A:
Q: #2 Is there a linear relationship between the distance of a house from a fire station and the fire…
A: Note: Hi there! Thank you for posting the question. As your question has more than 3 parts, we have…
Q: What is the slope of the line that contains these points? 15 17 19 21 -10 14 26 slope:
A:
Q: Create a linear model for the data in the table. 16 18 20 22 24 26 11 13 15 17 19 21 y Write a…
A: Given information: The coordinates of the linear model is shown below. x 12 16 18 20 22 24 y 7…
Q: Consider the dataset belew X Y 7 3 6 6 4 3 3 7 2 a. Find the sum of X : b. Find the sum of Y: c.…
A: Since, you have you have posted a question with multiple subparts we will solve first three subparts…
Q: nd the slope of the line represented by the data below. 2 6. 9 3 4 8. -3 -9 У 15 Simplify…
A: Given with the different points of the line and we have to find the slope of the given line which…
Q: Find the value of r so the line that passes through each pair of points has the given slope.…
A: Given: The line passes through the points (r,-5),(3,13) and having a slope m=8. Formula: When line…
Q: 3. Tell whether the slope of the line is positive, negative, zero, or undefined. 5- -5 -4 -3 3. 4.…
A:
Q: 4. Tell whether the slope of the line is positive, negative, zero, or undefined. 5- 4 3- 2- -2 2 -D2…
A: Slope of line is parallel to the y axis. And slope of the y axis is undefined.
Q: What is the slope of the line shown below? 10 (4, 6) (-7, 2) -10 10 -10+ O A 4 11 C. С. 11 O D. - 11
A: Solution is given by using slope intersept formula for a line from two points:
Q: The points in the table lie on a line. Find the slope of the line. 1 3 7 4 12 20 28 -4 4
A:
Q: Find the slope of the line given the tables below. 4-7. Find the slope of each table. 4. 5. y -6 5 1…
A:
Q: What line has the smallest measure of slope of the lines graphed below? 5t m 1t 1/2 3 4 -11 -5 -4 -3…
A: The slope of a line characterizes the direction of a line. To find the slope, you divide the…
Q: Short Response Each of the following pairs represents points that lie on the same line. Find the…
A:
Q: 1) Which best describes the slope of the given line? es A) negative B) positive C) undefined D) zero
A: Solution
Q: Find a point on the line and the line's slope. y+5 = (r+3) point on the line: D Undefined slope: U
A: We know that If slope of line(m) and a point(x1,y1) on the line is given Then eqaution of the line…
Trending now
This is a popular solution!
Step by step
Solved in 2 steps with 2 images
- Cost of Adding Employees The following table shows the cost, in millions of dollars, to Walmart of adding the given number of employees to each of its superstores.14 E = number of new employees 1 2 3 4 C = cost 89.6 179.2 268.8 358.4 a. Find a linear model for the data in the table. b. Explain in practical terms the meaning of the slope of the linear model you found in part a.Demand for Candy Bars In this problem you will determine a linear demand equation that describes the demand for candy bars in your class. Survey your classmates to determine what price they would be willing to pay for a candy bar. Your survey form might look like the sample to the left. a Make a table of the number of respondents who answered yes at each price level. b Make a scatter plot of your data. c Find and graph the regression line y=mp+b, which gives the number of respondents y who would buy a candy bar if the price were p cents. This is the demand equation. Why is the slope m negative? d What is the p-intercept of the demand equation? What does this intercept tell you about pricing candy bars? Would you buy a candy bar from the vending machine in the hallway if the price is as indicated. Price Yes or No 50 75 1.00 1.25 1.50 1.75 2.00The director of cooperative education at a state college wants to examine the effect of cooperative education job experience on marketability in the work place. She takes a random sample of 4 students. For these 4, she finds out how many times each had a cooperative education job and how many job offers they received upon graduation. These data are presented in the table below. Student CoopJobs JobOffer 1 1 4 2 2 6 3 1 3 4 0 1 Graphical method: Show the slope of the line y- intercept Equation of the regression line SSE If coop jobs is 3 for the fifth student, what is the value of the job offer?
- (c) If drinking an additional gram of alcohol each day raised the relative risk of breast cancer by exactly 0.01 , what would be the correlation between alcohol in wine intake and relative risk of breast cancer? A) There would be a poor quality, negative linear relationship. B) None of the options are correct. C) There would be a perfect, positive linear relationship. D) There would be a perfect, positive nonlinear relationship.1. The phone company Boom Mobile provides a calling service with a fixed cost of $17 per month, plus a variable cost of $0.12 per minute of calls. a. Presents a linear model, determining the total cost C per call service in the month. b. What does the slope represent in the linear model?A manufacturing company has three processing lines. Each processing line combines various raw materials to produce the same output, Y. One of the processing lines can combine units of input (X) to produce units of output (Y) such that there is a linear relationship between X and Y. The Chief Executive Officer wants the output model to be estimated for this processing line. Given the values of X and Y (in thousands of units) in the table below, and as the Director of Data Management, you are to: x 5 7 2 8 4 8 12 6 14 8 Determine the extent to which output changes as the input change and interpret your result. Find the intercept of the output model and interpret it. Write down the equation of the line of best fit for output. Determine the value of the extent of relationship between input (X) and output (Y), and interpret your result. Find the value of the coefficient of determination and interpret your result What will be the output level if the input…
- A manufacturing company has three processing lines. Each processing line combines various raw materials to produce the same output, Y. One of the processing lines can combine units of input (X) to produce units of output (Y) such that there is a linear relationship between X and Y. The Chief Executive Officer wants the output model to be estimated for this processing line. Given the values of X and Y (in thousands of units) in the table below, and as the Director of Data Management, you are to: x 5 7 2 8 4 8 12 6 14 8 Determine the extent to which output changes as the input change and interpret your result. Find the intercept of the output model and interpret it. Write down the equation of the line of best fit for output. Determine the value of the extent of relationship between input (X) and output (Y), and interpret your result. Find the value of the coefficient of determination and interpret your result.A manufacturing company has three processing lines. Each processing line combines various raw materials to produce the same output, Y. One of the processing lines can combine units of input (X) to produce units of output (Y) such that there is a linear relationship between X and Y. The Chief Executive Officer wants the output model to be estimated for this processing line. Given the values of X and Y (in thousands of units) in the table below, and as the Director of Data Management, you are to: x 5 7 2 8 4 8 12 6 14 8 Find the value of the coefficient of determination and interpret your result What will be the output level if the input usage is 15? What percentage of the changes in output is due to other raw materials apart from X? Test at 1 percent significance level, whether the correlation between X and Y exist.Explain what is meant when two variables are positively linesrly related. What would scatter plott look like? Two variables x and y are postively linearly related if when the x value increases , the y value increases or decrease? The points on a scatter plot fall approximately in a-an ascending straight line b- a descending curve c- a descending straight line or d- an ascending curve from left to right?
- A. Interpret the slope associated with mother's height and the intercept of this model. B. Calculate the test statistic that is labeled "C" in the output. C.What are the null and alternative hypotheses corresponding to the test statistic labeled "C" and its corresponding p-value in the output. H0: r = 0 HA: r ≠ 0 H0: b = 0 HA: b ≠ 0 H0: ρ = 0 HA: ρ ≠ 0 H0: β = 0 HA: β ≠ 0 D. What is the predicted height for a child born to a mother with a height of 67 inches and a father with a height of 71 inches? intercept of this model.1, Estimate a linear regression, with Quantity as your dependent (y) variable. Your independent variables are Price, Xmas, Summer, and the Day of the Week variables. 2. Write out the estimated equation. 3. For each value of price (0 through 100 in increments of 5), plug the price into the estimated regression equation to get a “predicted quantity.” What is the average of these predicted quantities? Quantity day Price Xmas Summer Monday Tuesday Wednesday Thursday Friday Saturday Sunday 121 1 62 0 0 1 0 0 0 0 0 0 168 2 44 0 0 0 1 0 0 0 0 0 132 3 52 0 0 0 0 1 0 0 0 0 230 4 16 0 0 0 0 0 1 0 0 0 232 5 28 0 0 0 0 0 0 1 0 0 368 6 7 0 0 0 0 0 0 0 1 0 225 7 63 0 0 0 0 0 0 0 0 1 115 8 63 0 0 1 0 0 0 0 0 0 143 9 50 0 0 0 1 0 0 0 0 0 79 10 74 0 0 0 0 1 0 0 0 0 85 11 61 0 0 0 0 0 1 0 0 0 210 12 47 0 0 0 0 0 0 1 0 0 265 13 41 0 0 0 0 0 0 0 1 0 348 14 20 0 0 0 0 0 0 0 0 1 117 15 61 0 0 1 0 0 0 0 0 0 124 16 49 0 0 0 1 0 0 0 0 0 45 17 89 0 0 0 0 1 0 0 0 0An economist believes there is a linear relationship between the marketprice of a particular commodity and the number of units suppliers of thecommodity are willing to bring to the marketplace. Two sampleobservations indicate that when the price equals $15 per unit, the weekly supply equals 30,000 units; and when the price equals $20 per unit, theweekly supply equals 48,000 units (i) If price per unit, p, is plotted on the horizontal axis and the quantitysupplied q is plotted on the vertical axis, determine the slope-intercept formof the equation of the line which passes through these two points.(ii) Interpret the slope of the equation in this application.(iii) Predict the weekly supply if the market price equals $25 per unit.