Find the standardized test statistic, z to test the claim that p, = P2. The sample statistics listed below are from independent samples. n, = 50, x, = 35, and n2 = 60, x2 = 40 O A. 1.328 O B. 2.361 Oc. 0.374 O D. 0.982
Find the standardized test statistic, z to test the claim that p, = P2. The sample statistics listed below are from independent samples. n, = 50, x, = 35, and n2 = 60, x2 = 40 O A. 1.328 O B. 2.361 Oc. 0.374 O D. 0.982

Glencoe Algebra 1, Student Edition, 9780079039897, 0079039898, 2018
18th Edition
ISBN:9780079039897
Author:Carter
Publisher:Carter
Chapter10: Statistics
Section10.4: Distributions Of Data
Problem 19PFA

Related questions
Question
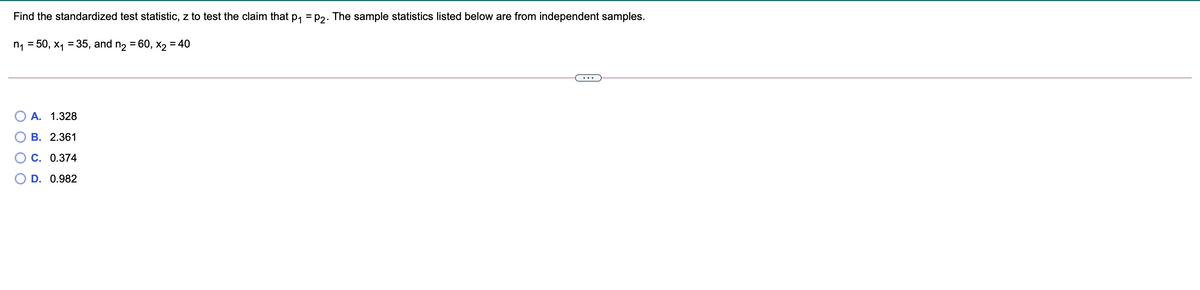
Transcribed Image Text:Find the standardized test statistic, z to test the claim that p, = p2.
The sample statistics listed below are from independent samples.
n1 = 50, x1 = 35, and n2 = 60, x2 = 40
...
О А. 1.328
В. 2.361
С. О.374
O D. 0.982
Expert Solution
This question has been solved!
Explore an expertly crafted, step-by-step solution for a thorough understanding of key concepts.

This is a popular solution!

Trending now
This is a popular solution!

Step by step
Solved in 2 steps with 2 images

Recommended textbooks for you
Glencoe Algebra 1, Student Edition, 9780079039897…
Algebra
ISBN:
9780079039897
Author:
Carter
Publisher:
McGraw Hill
Glencoe Algebra 1, Student Edition, 9780079039897…
Algebra
ISBN:
9780079039897
Author:
Carter
Publisher:
McGraw Hill