Find the standart deviation 8 11 14 17 19 21 21 12 13 a) 4,622 B) 3,642 NS) 2,548 D) 8,722 TO) 1,432
Find the standart deviation 8 11 14 17 19 21 21 12 13 a) 4,622 B) 3,642 NS) 2,548 D) 8,722 TO) 1,432

Algebra & Trigonometry with Analytic Geometry
13th Edition
ISBN:9781133382119
Author:Swokowski
Publisher:Swokowski
Chapter10: Sequences, Series, And Probability
Section10.2: Arithmetic Sequences
Problem 51E

Related questions

Concept explainers
Contingency Table
A contingency table can be defined as the visual representation of the relationship between two or more categorical variables that can be evaluated and registered. It is a categorical version of the scatterplot, which is used to investigate the linear relationship between two variables. A contingency table is indeed a type of frequency distribution table that displays two variables at the same time.
Binomial Distribution
Binomial is an algebraic expression of the sum or the difference of two terms. Before knowing about binomial distribution, we must know about the binomial theorem.
Topic Video
Question
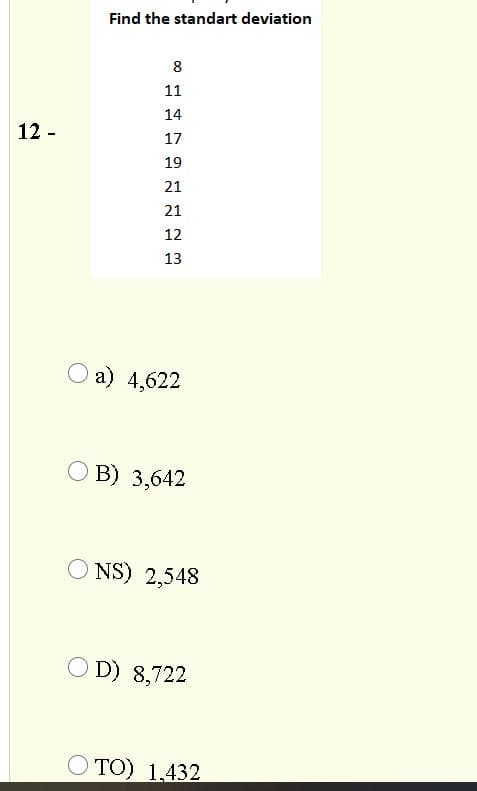
Transcribed Image Text:Find the standart deviation
8
11
14
12 -
17
19
21
21
12
13
О а) 4,622
О В) 3,642
O NS) 2,548
O D) 8,722
O TO) 1,432
Expert Solution
This question has been solved!
Explore an expertly crafted, step-by-step solution for a thorough understanding of key concepts.

Step by step
Solved in 3 steps with 2 images

Knowledge Booster


Learn more about
Need a deep-dive on the concept behind this application? Look no further. Learn more about this topic, statistics and related others by exploring similar questions and additional content below.Recommended textbooks for you
Algebra & Trigonometry with Analytic Geometry
Algebra
ISBN:
9781133382119
Author:
Swokowski
Publisher:
Cengage

Elements Of Modern Algebra
Algebra
ISBN:
9781285463230
Author:
Gilbert, Linda, Jimmie
Publisher:
Cengage Learning,
Algebra & Trigonometry with Analytic Geometry
Algebra
ISBN:
9781133382119
Author:
Swokowski
Publisher:
Cengage
Elements Of Modern Algebra
Algebra
ISBN:
9781285463230
Author:
Gilbert, Linda, Jimmie
Publisher:
Cengage Learning,