Find the test statistic. (Round to two decimal places as needed.) Choose the correct conclusion below. A. Reject the null hypothesis. There is enough evidence to support the claim. B. Fail to reject the null hypothesis. There is not enough evidence to support the claim. C. Fail to reject the null hypothesis. There is not enough evidence to reject the claim. D. Reject the null hypothesis. There is enough evidence to reject the claim.
Find the test statistic. (Round to two decimal places as needed.) Choose the correct conclusion below. A. Reject the null hypothesis. There is enough evidence to support the claim. B. Fail to reject the null hypothesis. There is not enough evidence to support the claim. C. Fail to reject the null hypothesis. There is not enough evidence to reject the claim. D. Reject the null hypothesis. There is enough evidence to reject the claim.

Glencoe Algebra 1, Student Edition, 9780079039897, 0079039898, 2018
18th Edition
ISBN:9780079039897
Author:Carter
Publisher:Carter
Chapter10: Statistics
Section10.4: Distributions Of Data
Problem 19PFA

Related questions

Concept explainers
Contingency Table
A contingency table can be defined as the visual representation of the relationship between two or more categorical variables that can be evaluated and registered. It is a categorical version of the scatterplot, which is used to investigate the linear relationship between two variables. A contingency table is indeed a type of frequency distribution table that displays two variables at the same time.
Binomial Distribution
Binomial is an algebraic expression of the sum or the difference of two terms. Before knowing about binomial distribution, we must know about the binomial theorem.
Topic Video
Question
7
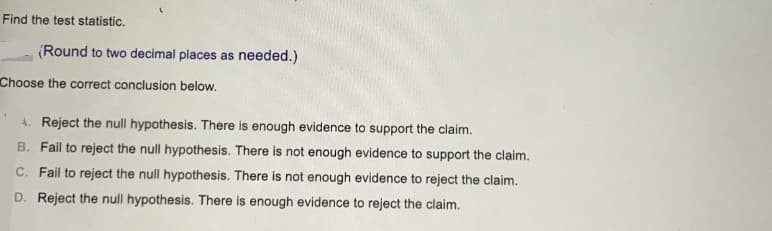
Transcribed Image Text:Find the test statistic.
(Round to two decimal places as needed.)
Choose the correct conclusion below.
A. Reject the null hypothesis. There is enough evidence to support the claim.
B. Fail to reject the null hypothesis. There is not enough evidence to support the claim.
C. Fail to reject the null hypothesis. There is not enough evidence to reject the claim.
D. Reject the null hypothesis. There is enough evidence to reject the claim.
Transcribed Image Text:Test the claim about the differences between two population variances of and o at the given level of significance a using the given sample statistics. Assume that the
sample statistics are from independent samples that are randomly selected and each population has a normal distribution.
Claim: o > 02,
a = 0.01
Sample statistics: s =809, n, = 7, s5:
242
= 659, n, = 5
.....
Find the null and alternative hypotheses.
OB. Ho: o>o
Hai of so3
OA Ho: o20을
OC. Ho: of <o3
Hạ: of 203
D. Ho: oso2
Hai o >o
Find the critical value.
I (Round to two decimal places as needed.)
Expert Solution
This question has been solved!
Explore an expertly crafted, step-by-step solution for a thorough understanding of key concepts.

Step by step
Solved in 3 steps with 3 images

Knowledge Booster


Learn more about
Need a deep-dive on the concept behind this application? Look no further. Learn more about this topic, statistics and related others by exploring similar questions and additional content below.Recommended textbooks for you
Glencoe Algebra 1, Student Edition, 9780079039897…
Algebra
ISBN:
9780079039897
Author:
Carter
Publisher:
McGraw Hill
Glencoe Algebra 1, Student Edition, 9780079039897…
Algebra
ISBN:
9780079039897
Author:
Carter
Publisher:
McGraw Hill