Find the value of the test statistic. W- Find the p-value. (Round your answer to four decimal places.) p-value=[ State your conclusion. Reject Ho. There is sufficient evidence to conclude the two population of CEO salaries are not identical. Reject Ho. There is sufficient evidence to conclude the two population of CEO salaries are identical.
Find the value of the test statistic. W- Find the p-value. (Round your answer to four decimal places.) p-value=[ State your conclusion. Reject Ho. There is sufficient evidence to conclude the two population of CEO salaries are not identical. Reject Ho. There is sufficient evidence to conclude the two population of CEO salaries are identical.

Holt Mcdougal Larson Pre-algebra: Student Edition 2012
1st Edition
ISBN:9780547587776
Author:HOLT MCDOUGAL
Publisher:HOLT MCDOUGAL
Chapter11: Data Analysis And Probability
Section11.5: Interpreting Data
Problem 9E

Related questions
Question
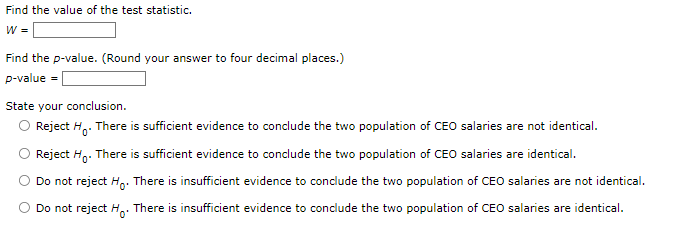
Transcribed Image Text:Find the value of the test statistic.
W =
Find the p-value. (Round your answer to four decimal places.)
p-value
State your conclusion.
Reject Ho. There is sufficient evidence to conclude the two population of CEO salaries are not identical.
Reject Ho. There is sufficient evidence to conclude the two population of CEO salaries are identical.
Do not reject Ho. There is insufficient evidence to conclude the two population of CEO salaries are not identical.
Do not reject Ho
There is insufficient evidence to conclude the two population of CEO salaries are identical.
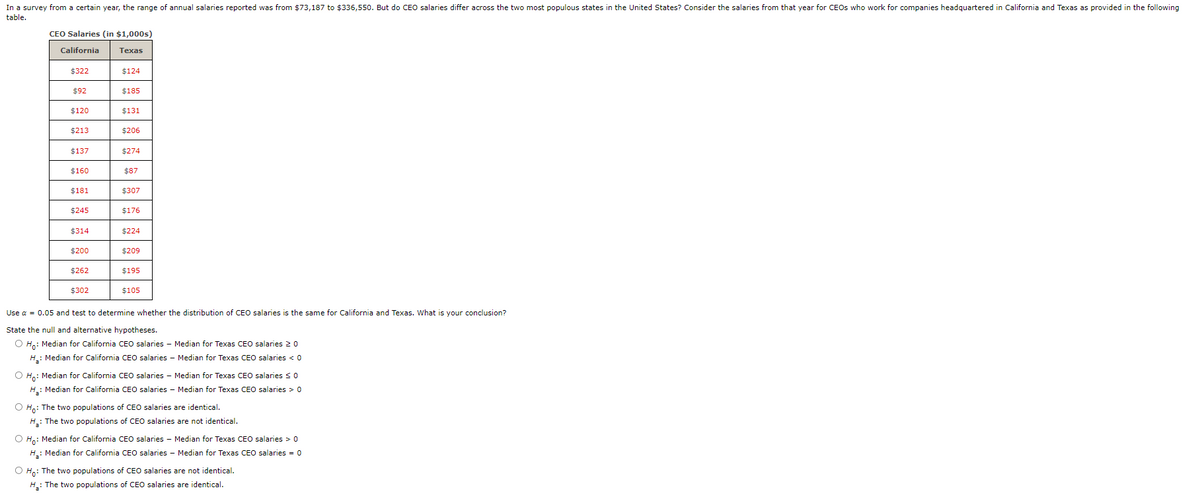
Transcribed Image Text:In a survey from a certain year, the range of annual salaries reported was from $73,187 to $336,550. But do CEO salaries differ across the two most populous states in the United States? Consider the salaries from that year for CEOS who work for companies headquartered in California and Texas as provided in the following
table.
CEO Salaries (in $1,000s)
California
$322
$92
$120
$213
$137
$160
$181
$245
$314
$200
$262
$302
Texas
$124
$185
$131
$206
$274
$87
$307
$176
$224
$209
$195
$105
Use a = 0.05 and test to determine whether the distribution of CEO salaries is the same for California and Texas. What is your conclusion?
State the null and alternative hypotheses.
O Ho: Median for California CEO salaries - Median for Texas CEO salaries 20
H₂: Median for California CEO salaries - Median for Texas CEO salaries < 0
O Ho: Median for California CEO salaries - Median for Texas CEO salaries ≤ 0
H₂: Median for California CEO salaries - Median for Texas CEO salaries > 0
O Ho: The two populations of CEO salaries are identical.
H₂: The two populations of CEO salaries are not identical.
O Ho: Median for California CEO salaries - Median for Texas CEO salaries > 0
H₂: Median for California CEO salaries - Median for Texas CEO salaries = 0
O Ho: The two populations of CEO salaries are not identical.
H₂: The two populations of CEO salaries are identical.
Expert Solution
This question has been solved!
Explore an expertly crafted, step-by-step solution for a thorough understanding of key concepts.

This is a popular solution!

Trending now
This is a popular solution!

Step by step
Solved in 4 steps

Recommended textbooks for you
Holt Mcdougal Larson Pre-algebra: Student Edition…
Algebra
ISBN:
9780547587776
Author:
HOLT MCDOUGAL
Publisher:
HOLT MCDOUGAL

Big Ideas Math A Bridge To Success Algebra 1: Stu…
Algebra
ISBN:
9781680331141
Author:
HOUGHTON MIFFLIN HARCOURT
Publisher:
Houghton Mifflin Harcourt

Glencoe Algebra 1, Student Edition, 9780079039897…
Algebra
ISBN:
9780079039897
Author:
Carter
Publisher:
McGraw Hill
Holt Mcdougal Larson Pre-algebra: Student Edition…
Algebra
ISBN:
9780547587776
Author:
HOLT MCDOUGAL
Publisher:
HOLT MCDOUGAL
Big Ideas Math A Bridge To Success Algebra 1: Stu…
Algebra
ISBN:
9781680331141
Author:
HOUGHTON MIFFLIN HARCOURT
Publisher:
Houghton Mifflin Harcourt
Glencoe Algebra 1, Student Edition, 9780079039897…
Algebra
ISBN:
9780079039897
Author:
Carter
Publisher:
McGraw Hill