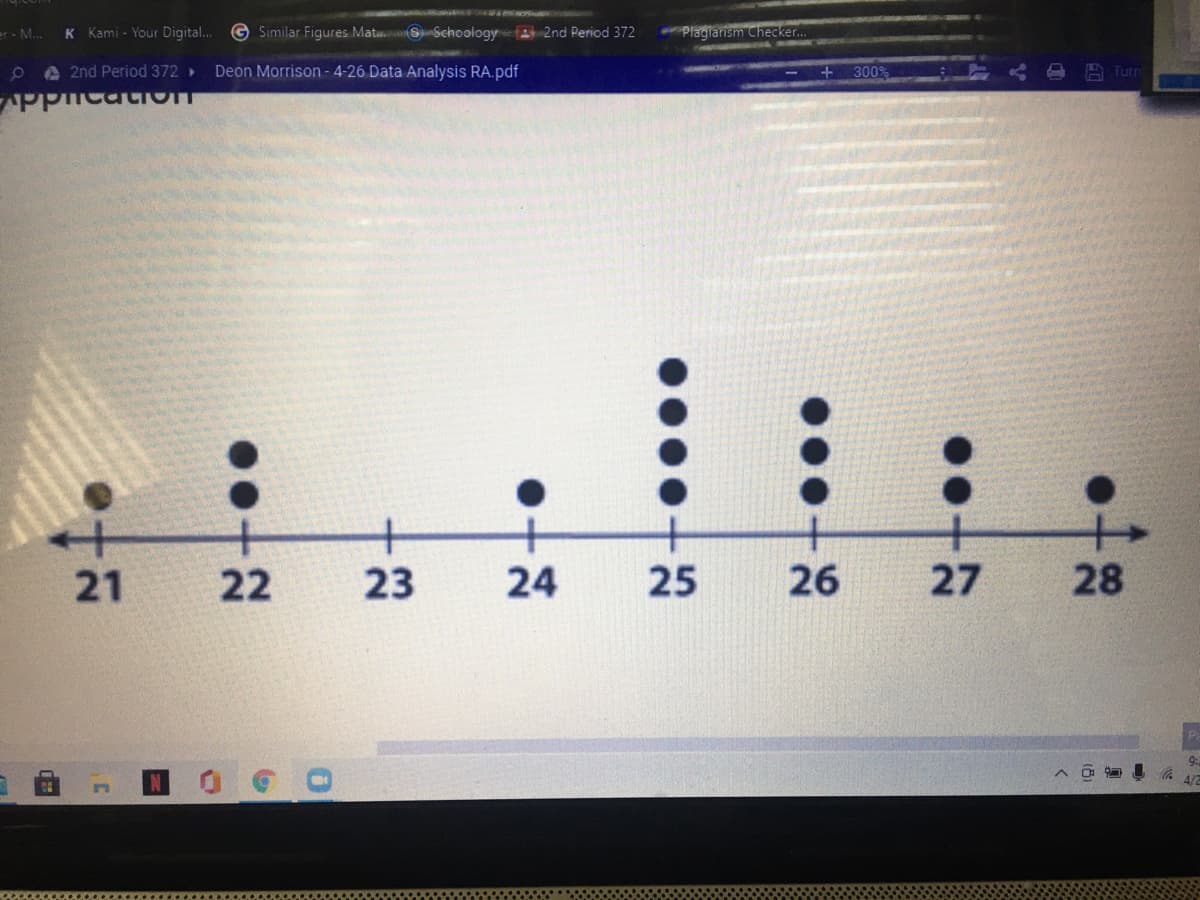
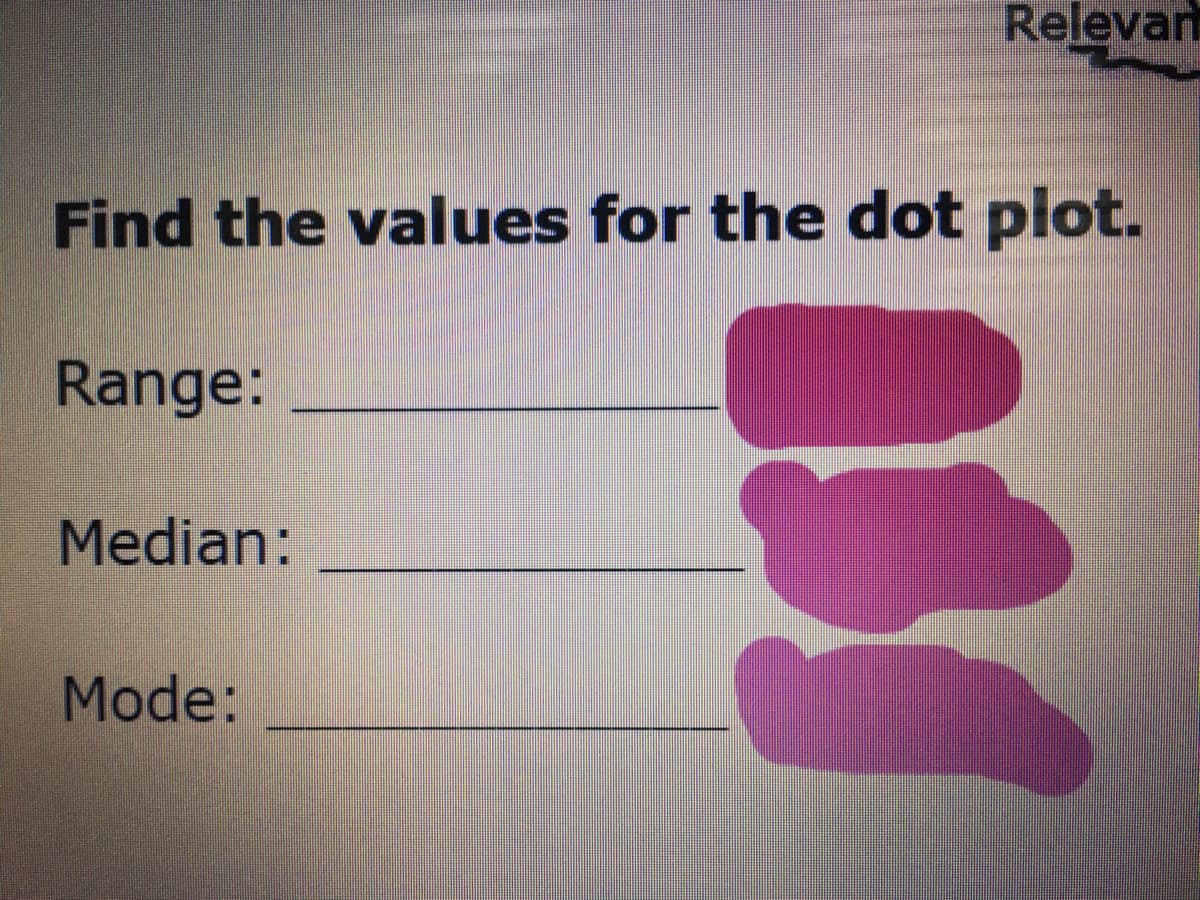
Find the values for the dot plot. Range: Median: Mode:
Q: Make a dot plot which represents the textbook data.
A:
Q: vMin, Q1, Median, 1. Range skewed left, skew Also called the median
A: Five number summary = min , Q1 , Median , Q3 , Max Max minus Min = Range Three distributions of…
Q: Find the mode and midrange.
A: Given data is…
Q: Which equation BEST fits the data in the given table? Use the table to answer the question.
A: Half life means time required to reduce the amount of substance remains in to the half quantity.
Q: Make a Box plot for each data interpreter answer. A. Data a: 2,3,6,4,6,7,8,10
A: Given data: 2,3,6,4,6,7,8,10
Q: This dot plot shows the number of runs scored by the Yel Jackets in their last 12 baseball games.…
A: The given dot plot shows the number of runs scored by the Yellow Jacket in their last 12 baseball…
Q: What is the range of the dot plot? * 21 22 23 24 25 26 27 28
A: Need to find the range of the above data plot.
Q: 主产 Which line segment represents the median? Blue O Green O Red
A: The object is to determine the line that represent the median of the given triangle. The median of a…
Q: The below plot represents:
A: option c is the right answer i,e distributed random number generation
Q: Make a scatter plot of this data. Which point appears to be an outlier?
A: Given:
Q: Match the data sets with the most appropriate scatter plot and describe the type of relationship.…
A: Graph of the data is given we have identify the which one suit the match
Q: y(x) = Graph the data and the best-fit line.
A:
Q: the
A:
Q: Please interpret box plot given summary statistics.
A: Box plot is a visual display of five number summary.
Q: If you are constructing a box plot, what is the value that is at the upper end of the "box?"
A: Here given 5 point summary 18,19,20,21,45
Q: In which scatter plot is r= 0.01? C e d.
A: Positive correlation: If the one variable is increases, then other variables also increased. If the…
Q: The Highway Patrol, using radar, checked the speeds (in mph) of 30 passing motorists at a…
A: Given: 44 38 41 50 36 36 43 42 49 48 35 40 37 41 43 50 45 45…
Q: Answer the problem below. Veronica is tasked to get the weekly orders of diesel from different…
A: Given: Station A Mon 24 Tues 56 Wed 33 Thurs 45 Fri 40 Sat 42 Sun 39…
Q: A physician recorded the resting heart rates of some of her patients. She also recorded the average…
A:
Q: Use the side-by-side boxplots shown to complete parts (a) through (e). y 30 60 90 120 (a) What is…
A: The box plot is made by the five number summary as
Q: Given the following table of values, identify the slope -6 13 -3 17 21 3 25
A: Given that a table of x and y value and we find slope use this value . We know that if two points…
Q: Which line represents the best fit for the scatter plot data?
A: A line is said to best fit if it fits maximum of data points in the scatter plot.
Q: A supermarket keeps track of the amount of bananas sold each week. The following table shows the…
A: Here stem and leaf diagram for amount sold Here 12|6 that represents 126
Q: Which equation best represents the data in this table? y 0.5 -0.75 1 1.5 0.5 0.75 y = In r B y= 1 23
A:
Q: Find the slope of the median CD. 8 A(1. 7). C(4, 3) B(-1. -1), C. 0 d 3 a. C. b. 4 4
A:
Q: Use a graphing calculator to graph the circle on an approximate square viewing window. *+y? = 25
A: Given, x2+y2=25
Q: From the stem and leaf plot below, determine the median
A: In the stem and leaf plot, the left side column is called the stem and the right side column is…
Q: If all the plots on a scatter diagram lie on a straight line, what is the standard error of…
A: Scatter diagram: It is a tool for analyzing the correlation between the dependent variable and…
Q: Make a box plot for each data. Interpret your answer. 1. Data A: 2, 3, 6, 4, 6, 7, 8, 10
A: 1. Step-by-step procedure to draw Box plot using Excel: In Excel sheet, enter and select Data A in…
Q: Use the data in the table below to answer the following questions. X-variable Y-variable Point 8. B.…
A: The coordinate points of triangle ABC are A(0,8) B(0,5) C(30,5) We need to find the area of the…
Q: There are three types of plot to choose from: boxplot, bar chart, and pie chart. Which of the plots…
A: Solution: Discrete variable: A variable is said to discrete if it is finite and countable. It…
Q: How well does the line describe the data? What is the mileage that you would expect a 4000-pound car…
A: From the Scatter plot: Regression equation is y=-0.0052x+45.645 where, intercept a=45.645 and slope…
Q: a graphical display of the data to help determine whether the two variable are associated. Which of…
A: Given: A physician records the resting heart rates of some patients and also records the average…
Q: The proprietor of a fabrication shop wants to know if there is a relationship between the number of…
A: Given information: The variables in the given situation are number of hours on the lathe machine and…
Q: Which value of rwould be appropriate for the scatter plot shown? a) 0.9 200
A: A scatter plot is given.
Q: Use the dotplot to answer each question below. 8. What is the mode? Answer What is the median?…
A: From the given dot plot mode =? median =? what is the Shape ?
Q: Make a Box plot for each data interpreter answer. A. Data C: 21,31,26,28,30,28,45,32
A: Given data: 21,31,26,28,30,28,45,32
Q: Given (2,11), (4,18), (10,28), what is the intercept? The data are given as (x,y).
A: The formula of intercept is,
Q: Choose the correct plot below.
A: Using the given Data we have to draw the Normal Probability Plot We know that the Normal Probability…
Q: Which type of a plot in the following figure? 90 1 120 08 60
A: The given plot is:
Q: 21 22 23 24 Plot A
A: For First graph The mean is greater than median It means that the data is skewed right So the…
Q: On your paper, construct a scatter plot of the fuel economy and the carbon dioxide pollution.…
A:
Q: Baseball pitchers on a major league team throw at the following speeds, measured in miles per hour:…
A: Given data, Speed 72 84 89 93 100 90 88 80 84 87
Q: when does the line on a scatter plot best fit?
A: Data visualization is the process of denoting the numerical data visually. Data visualization can be…
Q: Twenty salesmen were asked how many phone cals they made on a givan day. The data was recorded in…
A: The dot plot looks like a stem and leaf plot but here we write the frequency values in dotted form.…
Q: g. What percent of the variation among neighborhoods in shooting deaths is explained by the…
A: R2 is the regression coefficient which is equal to the square of correlation coefficient.
Q: A researcher wants to represent the difference in the prevalence of infant mortality rates among a…
A: Answer - A researcher wants to represent the difference in the prevalence of infant mortality rates…
Q: The plot above is created with the pa
A:
Q: Make a Box plot for each data interpreter answer. A. Data b: 33,22,23,29,40,43,47,49
A: Given data: 33,22,23,29,40,43,47,49
Q: Construct a stem-and-leaf plot and describe the shape of the distribution Gasoline Mileages: The…
A: Stem and leaf plot. The stems are listed in the left side of the vertical line and these numbers…
Step by step
Solved in 2 steps with 2 images