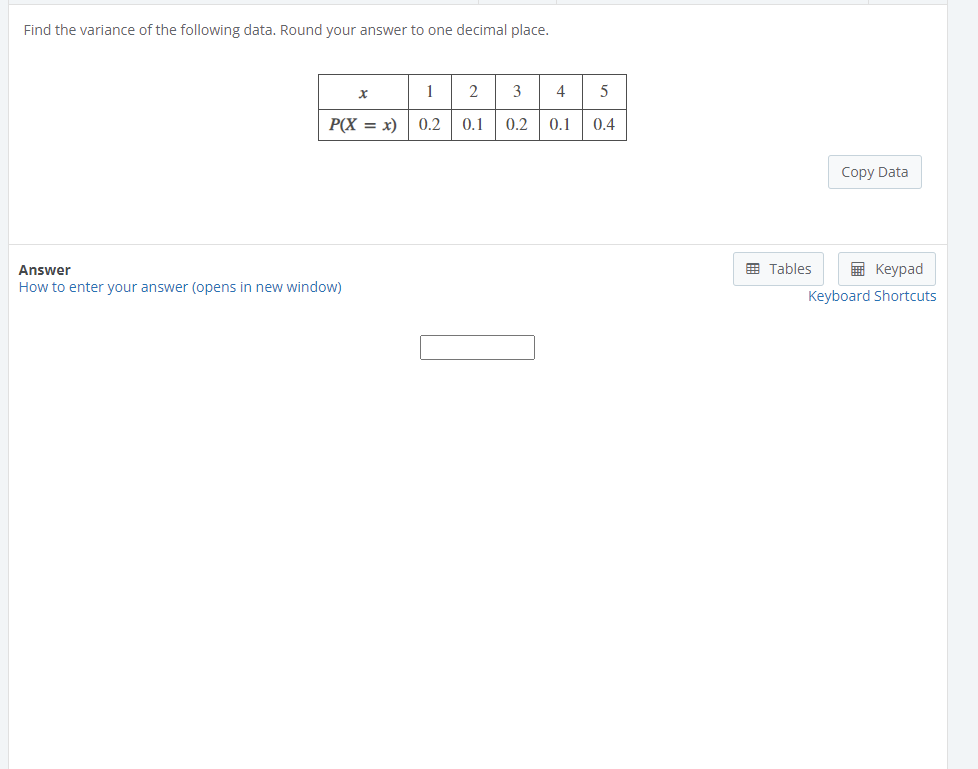
Find the variance of the following data. Round your answer to one decimal place.


Q: If the correlation coefficient between variables is .60, how much of the variance is unexplained by…
A:
Q: The following data set represents the ages of all 6 of Nancy's grandchildren. 11, 8, 5, 6, 3, 9 Find…
A: The number of observations, n=6. The mean is calculated below.
Q: Use a calculator to find the variance of this sample data: 194 198 117 107 120 162 151 169 185 139…
A: Use Ti calculator to find the variance as follows: Select STAT > Edit > Enter the values of…
Q: This assignment will assess your ability to calculate the mean, median, mode, variance, and standard…
A: Given: Sample size n = 63 Formula Used: Sample variance s2 = ∑i=1n(Xi-X)2n-1 Where, X is a sample…
Q: Following are the quartile values of a data set, The value of Q1 = 25 %3D The value of Q, = 43 %3!…
A: Given : Q1 = 25Q2 = 43Q3 = 43
Q: The following table shows the results of an analysis of variance comparing three treatments. What is…
A: Given that the table shows the results of an analysis of variance comparing three treatments.
Q: Consider the following data. Find the variance. Round your answer to one decimal place.
A: Answer:- Given probability mass function of X x -5 -4 -3 -2 -1 P(X = x) 0.2 0.3 0.2 0.1 0.2…
Q: Find the variance of the following data. Round your answer to one decimal place. 7 8. 9. 10 11 P(X =…
A: Given that, X 7 8 9 10 11 P(X=x) 0.3 0.2 0.1 0.2 0.2
Q: The following data are the final exam scores of 13 students in a very large calculus class. 96 75 86…
A: According to the given information in this question We need to find range variance and standard…
Q: A population of grades for a statistics class of six students is given below: 90 65 70 85 86 70 Find…
A: given data : 90,65,70,85,86,70
Q: In the data set below, what is the variance? 3 7 2 8 5 9 1 If the answer is a decimal, round it to…
A: Given data (3,7,2,8,8,9,1) n=7
Q: The following data are the final exam scores of the 15 students in a small calculus class. 93 83 72…
A: Solution Given data repersent the score in a small calculus class.
Q: Q2 : A: Find the standard deviation and variance of the following data classes 10- 13- 16- 19-22…
A: Given data is Classes 10- 13- 16- 19-22 frequency 4 12 20 14 Class width = Upper class limit…
Q: The following are final grades (in terms of percentages) from a class of 20 students. 75 70 84 90 92…
A:
Q: Lucas recorded his lunch expenditure each day for one week in the table below. Day Sunday Monday…
A:
Q: The numbers of absent days a student had in the last five months are {0, 4, 2, 0, 3}. What is the…
A:
Q: Q1/ The table below gives the number of accidents each year at a particular road junction : 2000…
A: “Since you have asked multiple questions, we will solve the first question for you. If you want any…
Q: What is the variance for the following set of scores? Scores: 4, 1, 7 6 (66/3) = 22 9 18
A:
Q: Use a calculator to find the variance of this sample data: 170 148 196 164 200 177 134 181 179 186…
A: According to the given information, we have Data set: 170,148,196,164,200,177,134,181,179,186
Q: The following data are the final exam scores of the 12 students in a small calculus class. 81 90 99…
A:
Q: d the mean, variance and standard deviation of the following data: X 19 20 21 22 23 P(X) 0.2 0.2 0.3…
A: From the given information we find the solution.
Q: Consider the following data set: 0, 2, 2, 3, 5, 6, 3 (a) µ = (b) Variance = (c) σ = (Round…
A: Given data 0,2,2,3,5,6,3 n=7
Q: The owner of a manufacturing plant employs eighty people. As part of their personnel file, she asked…
A:
Q: The following data set represents the ages of all 6 of Nancy's grandchildren. 11,8,5,6,3,9 Find…
A: Given that, 11, 8, 5, 6, 3, 9 N=6
Q: Given data points (2, -1), (2. 1). (3,2),(0, -1), and (3, -1), find the total variance of the data.
A: Given : Data : (2, -1), (2. 1). (3,2),(0, -1), and (3, -1) Using data, For x =2 we have 2 different…
Q: For a given data set the Sum of Squares is 212.69 and the sample size (n) is 11. What is the…
A: Given that Sum of squares (SS) = 212.69 Sample size (n) = 11 We know that Variance (S2) = SSn-1…
Q: Given the following data. Find the variance: 2,4, 3,5 اختر احدى الدجابات O None 1.25 O 54 1.666
A: Measures of Dispersion: The word dispersion is used to denote the degree of heterogeneity in the…
Q: If the sample standard deviation for the number of members at each of 25 fitness clubs is 41, what…
A:
Q: If the correlation coefficient for X and Y is calculated to be –.75, what is the proportion of…
A: Coefficient of determination:It also referred as R-square. The coefficient of determination is the…
Q: For each of the data sets below, which appears to have the highest variability? Explain your answer.…
A: #Ans : For each of the data sets below, which appears to have the highest variability…
Q: Solve the following problems, BOX your final answer. 3. The bank auditor selects 11 checking…
A: We have given that, The data set is,…
Q: Find the variance of the following data set. 9, 6, 8, 8 NOTE: Round your answer to TWO decimal…
A: Given data set is 9,6,8,8
Q: The heights, in inches, of the four members of a barbershop quartet of singers are listed below.…
A: The value of mean is obtained below:
Q: Four of your classmates measured the diagonal length of the blackboard. Classmate A measured it as…
A:
Q: Given data points (2. -1). (2, 1). (3, 2). (0,- 1)and (3, -1). find the total variance of the data.
A: Given: Data : (2 , -1 ) , (2 , 1 ) , (3 , 2) , (0 , -1), (3,-1)
Q: From the community hospital and clinics around a city, the ages of dentists, nurses and physicians…
A:
Q: Find the variance for the given sample data. Round your answer to one more decimal place than the…
A: Heh there! Thanks for posting the question. Since your question has more than one question, we…
Q: The Variance of Population for the following data :X = 155, 175, 125, 155, 175, 195, 185, 525, 255,…
A:
Q: Give an interpretation for the following data.
A: Given: Bar graph of average height of female and male student is given here. Bar graph is the chart…
Q: The following data are the final exam scores of the 15 students in a small calculus class. 83 72 74…
A: Solution-: We want to obtained, (a) Are these population or sample data? (b) Range of data set (c)…
Q: What is the variance of X in the following data? -2 | -1 | 0 | 1 | 2 | 3 -3 -1 -2 4 Select one: 17.5…
A:
Q: find the variance for the given data 7 7 2 5 1
A: The mean of the data can be calculated as:
Q: The following set of data is given 2; 4; 5; 3; 6; 2; 3 Determine the value of coefficient of…
A: From the provided information, The mean and standard deviation of the data can be obtained as:
Q: Ms. Johnson uses a statistics program to analyze all the data collected by her students during a lab…
A: topic- statistics
Q: Which of the following best describes the variance for this sample of observations: 2.3, 4.5, 6, 8…
A: In this question, we have data for which we have to calculate the standard deviation and tell that…
Q: One sample has n = 5 scores and the second has n = 10 scores. If the pooled variance for the two…
A: Given information Pooled variance = 30 n1 = 5, n2 = 10
Q: Given a sample data set with a Variance of 12.25 and Mean of 4.0, what is the Coefficient of…
A: Variance = 12.25 Mean = 4
Q: The wholesale price of a commodity for seven consecutive days in a month is as follows: Days…
A:
Q: What is the variance for the following population of scores? Scores: 2, 2, 2, 2 Group of answer…
A: The mean of the score can be calculated as:
Q: For the following scores: 6, 2, 3, 0, 4 : A) If these scores are a population, what are the…
A: Use EXCEL Procedure for finding the value of population variance. Follow the instruction to obtain…


Trending now
This is a popular solution!

Step by step
Solved in 2 steps
