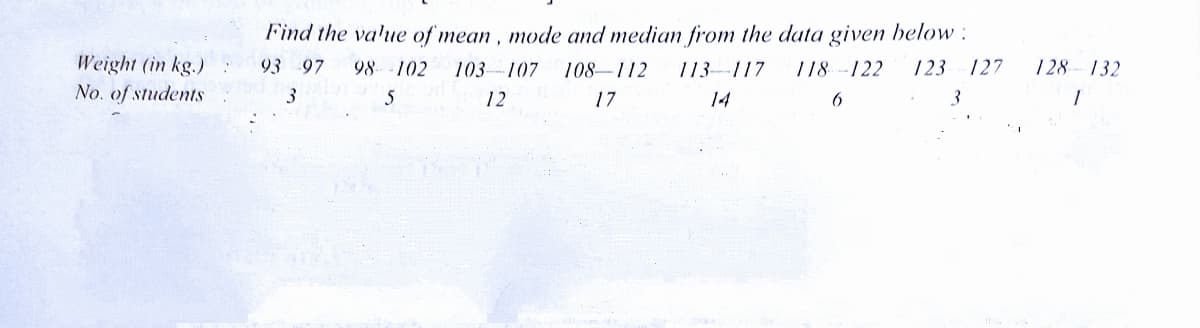
Find the va'ue of mean , mode and median from the data given below : Weight (in kg.) : No. of students 93 97 98-102 103-107 108-112 113–117 118 --122 123 127 128- 132 3 5 12 17 14 3.


Q: Find the (a) mean, (b) median, (c) mode, and (d) midrange for the data and then (e) answer the given…
A: Given data is…
Q: How hot does it get in Death Valley? The following data are taken from a study conducted by the…
A: It provided that the sample size of ground temperature (n) is 14.Consider X is defined as the ground…
Q: Find the mean, the median, and the mode of the following scores. (If an answer does not exist, enter…
A: Solution: x(1) Frequency (f)(2) f⋅d(4)=(2)×(3) cf(6) 50 2 -2 -4 2 60 5 -1 -5 7 70=A 9 0 0…
Q: The following data showing the heights of plants of two varieties of wheat:- Variety 1 Variety 2…
A: The given data is, Variety 1 Variety 2 87 82 91 84 89 85 88 83 89 90 91 89 87 94…
Q: Students in an experimental psychology class did research on depression as a sign of stress. A test…
A: The answer is attached below,
Q: Find the value of mean and mode from the data given below : Weight in Kg: No. of Students: 93-97…
A: Given that Class Frequency (f) Mid value (x) f⋅x 93-97 3 95 285 98-102 5 100 500 103-107…
Q: Refer to the data set of body temperatures in degrees Fahrenheit given in the accompanying table and…
A: Arrange the data in non descending order 96.5 96.5 96.6 96.7 96.8 96.9 96.9 96.9…
Q: A study is run to estimate the mean total cholesterol level in children 2 to 6 years of age. A…
A:
Q: The top speed (in miles per hour) for a sample of seven sports cars is given below. Find the mean,…
A: Calculate Mean, Median, Mode, Quartile-3 from the following…
Q: The final grades of a student in his subjects where he was enrolled were taken and shown below.…
A: Given Information: Subject No. of units (wi) Final grade (xi) Math 1 3 2.5 Lab…
Q: The box-and-whisker plots below show the mean monthly temperatures (°F) for Mexico City, Mexico, and…
A:
Q: On Friday night, the owner of Chez Pierre in downtown Chicago noted the amount spent for dinner for…
A: Step-by-step procedure to obtain descriptive statistics using MINITAB: Stat > Basic Statistics…
Q: 1) In the data set below, what are the lower quartile, the median, and the upper quartile? 48 48 58…
A: Th given data is: 48, 48, 58, 74, 80, 84, 93 There are 7 values. So the median is the (7+1)/2= 4th…
Q: Find the mean, median, mode, and range for the following set of data: 12 15 16 11 18 19 12 11 9 12…
A:
Q: Using the given data below, compute the following statistics: 90 100 83 78 60 73 89 81 94 a) Mean b)…
A: a) The mean of the data is given as Mean=Sum of all observationsTotal number of…
Q: Construct a frequency distribution table for the fol- lowing set of scores. Include columns for…
A: Introduction: The frequency distribution for the given scores is to be constructed.
Q: The following data show the yearly salaries of football coaches at some state supported universites…
A: Given yearly salary of football coaches at some universities, State salary(x) A 53 B 44 C…
Q: The line plots below show exa i scores from greater mean score? Which class has a greater median…
A: Concentration of all values around the central value is called measures of central tendency.…
Q: Find the mean, median, and mode of the following data: 12 16 15 12 16 Mean = 10 11 18 O Mean = 12,…
A: Know that Mean = sum of all observations/total number of observations Median = middle value of the…
Q: The manager of a local RV sales lot has collected data on the number ofRVs sold per month for the…
A: Weighted mean of sales per month =3.23 Option c is correct
Q: Find the mean, the median, and the mode of the following scores. (If an answer does not exist, enter…
A: Obtain the value of mean. The value of is obtained below: From the information, given that The…
Q: A sample of college students was asked how much they spent monthly on coffeecoffee. Approximate the…
A: The following table shows the calculation of mean cost spent on coffee,
Q: Flu season: Suppose the following tables present the number of specimens that tested positive for…
A: Given that Type A influence in a country during a flu season Type B influence in a country during…
Q: A college student wants to determine whether the stress level of a student is associated to his/her…
A:
Q: Find the mean, median, and mode of the data. Heights of Students in Class |||| || ||T 60 62 64 66 68…
A: From the given dot plot, the data values are 60, 64, 65, 65, 66, 67, 67, 67, 69, 69, 70, 72, 72, 74,…
Q: The table below shows the scores of a group of students on a 10-point quiz. Test Score Frequency 3.…
A: Solution: Given frequency distribution is Test score (x) Frequency (f) fx Cumulative frequency…
Q: Given the following set of times (in minutes) needed by a sample of students to complete a final…
A:
Q: Find the mean, median, and mode of the following data. If necessary, round to one more decimal place…
A: We have to arrange data in ascending order:…
Q: The weight in milligrams of 2538 seeds of the long leef pine were as follows : Class (weight in…
A: Given, Class Frequency(f) Mid Value (X) d = X-Ah=X - 92.4515A = 92.45, h = 15 f.d cf 10-24.9…
Q: Find the mean, median, and mode of the following data: 12 15 16 11 18 19 12 11 9 12 16 12 10 O Mean…
A:
Q: Find the (a) mean, (b) median, (c) mode, and (d) midrange for the data and then (e) answer the given…
A: Given data set224 273 282 277 268 246 209 196 268 272 209
Q: Find the mean and the mean deviation about mean from the following frequency distribution : Weight…
A: Mean deviation about mean : the mean of absolutely the values of the numerical variations between a…
Q: The sale prices for homes in a certain city are as follows. Location Price 415 First…
A:
Q: Golf scores from a recent WPGA tournament is shown below. Compute the mean, median, mode and…
A: The objective to find the mean, median, mode and midrange of the given data set.
Q: The owner of a retailing organization is interested in the relationship between price at which a…
A: Given, the data of the price at which the commodity is offered for sale and the quantity sold. The…
Q: A national survey of graduate students is conducted to assess their consumption of coffee. The…
A: The total number of graduate students is, 145+80+94+121+365+430=1235.
Q: the mean, median and mode, Q1, Q3, De and P of the following grouped data. Veights of Employees in…
A: It is a single value within the range of data which represents a group of individuals values in a…
Q: Test the following data to see if the mean high temperature (in Fahrenheit) in Japan is higher than…
A: Given, Test the following data to see the mean high temperature in Japan is higher than the mean…
Q: 36. Find the va'ue of mean, mode and median from the data given below: 93 97 98 -102 103-107 108-112…
A: We have to find the mean, Median and Mode of the given above group data table = ?
Q: The U.S Energy Information Administration publishes data on residential consumption and expenditures…
A: To testH0:μ1-μ2=0H1:μ1-μ2≠0
Q: below are the numbers on the jerseys of the starting lineup for the New Orleans Saints when they won…
A: The given data is appropriate for measures of central tendency.
Q: Using the given data below, compute the following statistics: 80…
A: Given : 80, 110, 83, 78, 60, 73, 89, 81, 94 a) mean = ∑Xin mean = 7489 mean = 83.11 b) Arrange the…
Q: The semi-averages of the below given data are: Year Rainfall 1999 21 2000 11 2001 14 2002 16 2003 18…
A:
Q: Refer to the data below. 38 42 26 22 30 42 36 42 1)The mean is 2)The range is: 3)The difference…
A:
Q: Find the (a) mean, (b) median, (c) mode, and (d) midrange for the data and then (e) answer the given…
A: We have given that data 1950,1650,1800,1650,1450,1250,1650,1200,1250,1550,1650,1100 Mean= sum of all…
Q: Find the mean of the data summarized in the given frequency distribution. Compare the computed mean…
A: Given: A frequency distribution table. Speed(miles per hour) 42-45 46-49 50-53 54-57 58-61…
Q: A college student wants to determine whether the stress level of a student is associated to his/her…
A:
Q: The following table displays the ages of female actors when they starred in their award-winning…
A: Solution: Let X be the age of female actor. The given data is 40, 42, 34, 33, 30, 28, 30, 34, 31,…
Q: Which histogram below shows a data set that is skewed right? O a) 123 4 5 6 7 8 9 10 Data Value Ob)…
A: Question is related to statistics.
Q: The frequency table shows the mass in kilogram, collected from a class. Mass (kg) No. of students 45…
A:

Step by step
Solved in 5 steps with 5 images
