firmon the doofer relaties to the field of day burk (x1) eight Ks and girth *3 for 18 einenona. The $3 сбежала степона, thanie, coffrelation efficient were attented i M₁₂ = 077₁ P=007/2 ad +2320152 Find the partial cofituelation cofficedant to 12 13 and mutiple entrelation cafftecent R1123.
firmon the doofer relaties to the field of day burk (x1) eight Ks and girth *3 for 18 einenona. The $3 сбежала степона, thanie, coffrelation efficient were attented i M₁₂ = 077₁ P=007/2 ad +2320152 Find the partial cofituelation cofficedant to 12 13 and mutiple entrelation cafftecent R1123.

Algebra & Trigonometry with Analytic Geometry
13th Edition
ISBN:9781133382119
Author:Swokowski
Publisher:Swokowski
Chapter7: Analytic Trigonometry
Section7.6: The Inverse Trigonometric Functions
Problem 94E

Related questions
Question
Please don't reject my question. If you don't know the answer please don't reject it.
Don't copy and paste the answer, dont give the answer in incomplete steps and don't give the wrong answer, will give the downvote for these mistakes.
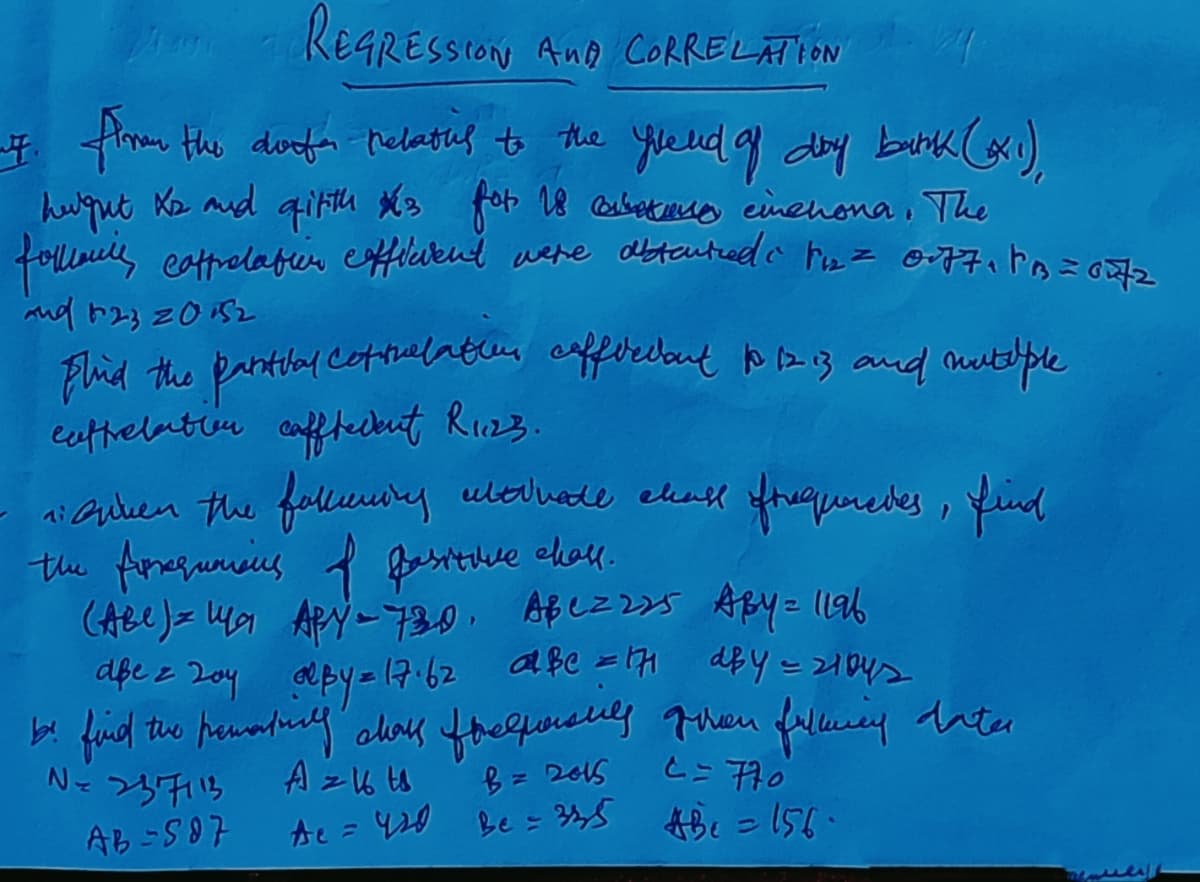
Transcribed Image Text:REGRESSION AND CORRELATION
. from the dorfer relating to the field of day bank (₁)
hugut Ks and quitth 3 for 18 einenona. The
follianis coffrelation efficient were obtented in the = 0771PB=0272
and 12320152
Flind the partial Cotilatter cofficedant 10 12 13 and mutelple
cuttrelation cafftecent R1123.
is given the following ultivate ehall of frequencies, find
the forquions of pasitive chall.
(ABC) = 149₁ APY - 730, Abc=225 Aby = 1196
abc = 171 d&y= 21042
apez 20y aby = 17.62 aße = 171
be find the premately class fralforshly given fulming dater
A = 16 ts
N = 237113
B = 2015
C = 770
AB-587
Ae = 420 Be= 325 #Be=156-
Expert Solution
This question has been solved!
Explore an expertly crafted, step-by-step solution for a thorough understanding of key concepts.

Step by step
Solved in 3 steps with 3 images

Recommended textbooks for you
Algebra & Trigonometry with Analytic Geometry
Algebra
ISBN:
9781133382119
Author:
Swokowski
Publisher:
Cengage
Algebra & Trigonometry with Analytic Geometry
Algebra
ISBN:
9781133382119
Author:
Swokowski
Publisher:
Cengage