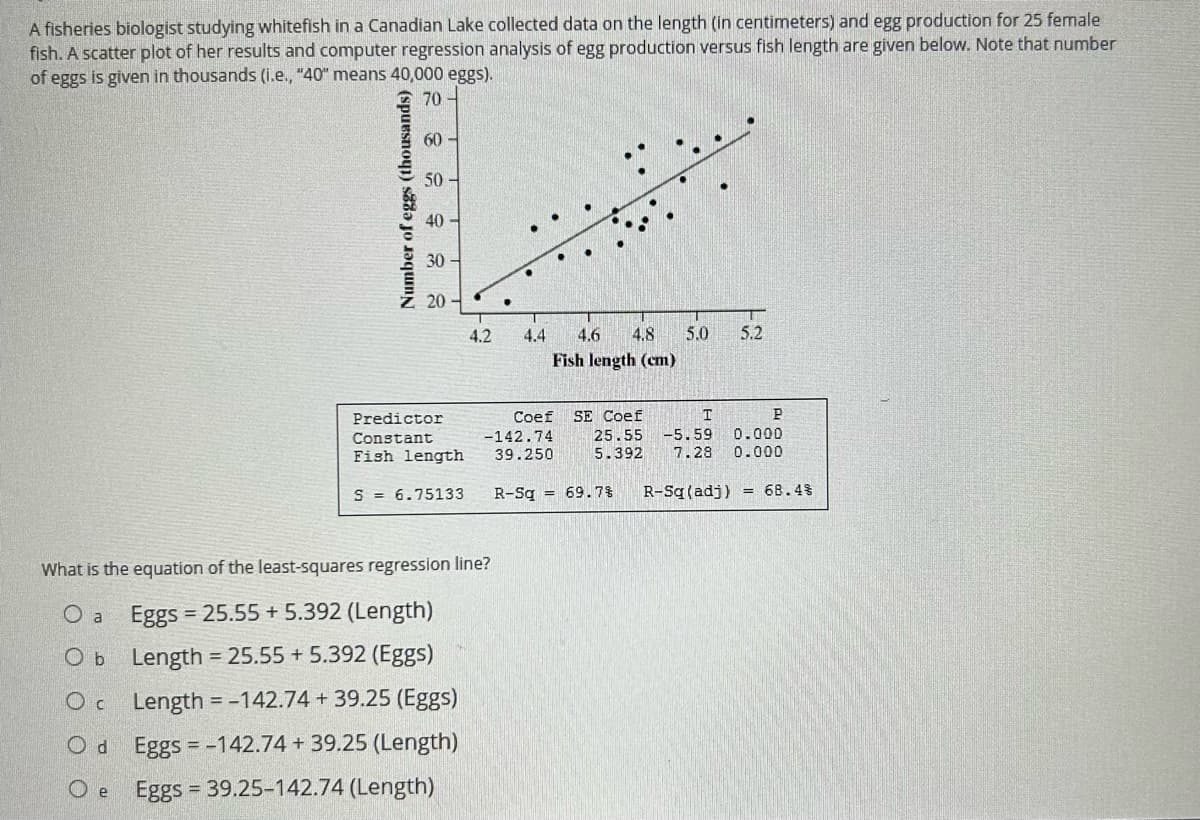
fisheries biologist studying whitefish in a Canadian Lake collected data on the length (in centimeters) and egg production for 25 female sh. A scatter plot of her results and computer regression analysis of egg production versus fish length are given below. Note that number of eggs is given in thousands (i.e., "40" means 40,000 eggs). 70 Number of eggs (thousands) 60- 50- 40 30 20 4.2 4.4 4.6 4.8 5.0 5.2 Fish length (cm) Coef -142.74 39.250 What is the equation of the least-squares regression line? O a Eggs = 25.55 +5.392 (Length) Ob Length = 25.55 + 5.392 (Eggs) Oc Length = -142.74 +39.25 (Eggs) Od Eggs = -142.74 + 39.25 (Length) Oe Eggs = 39.25-142.74 (Length) Predictor Constant Fish length S= 6.75133 R-Sq= 69.7% I SE Coef 25.55 -5.59 5.392 7.28 0.000 P 0.000 R-Sq (adj) = 68.4%
fisheries biologist studying whitefish in a Canadian Lake collected data on the length (in centimeters) and egg production for 25 female sh. A scatter plot of her results and computer regression analysis of egg production versus fish length are given below. Note that number of eggs is given in thousands (i.e., "40" means 40,000 eggs). 70 Number of eggs (thousands) 60- 50- 40 30 20 4.2 4.4 4.6 4.8 5.0 5.2 Fish length (cm) Coef -142.74 39.250 What is the equation of the least-squares regression line? O a Eggs = 25.55 +5.392 (Length) Ob Length = 25.55 + 5.392 (Eggs) Oc Length = -142.74 +39.25 (Eggs) Od Eggs = -142.74 + 39.25 (Length) Oe Eggs = 39.25-142.74 (Length) Predictor Constant Fish length S= 6.75133 R-Sq= 69.7% I SE Coef 25.55 -5.59 5.392 7.28 0.000 P 0.000 R-Sq (adj) = 68.4%

Trigonometry (MindTap Course List)
8th Edition
ISBN:9781305652224
Author:Charles P. McKeague, Mark D. Turner
Publisher:Charles P. McKeague, Mark D. Turner
Chapter4: Graphing And Inverse Functions
Section: Chapter Questions
Problem 6GP: If your graphing calculator is capable of computing a least-squares sinusoidal regression model, use...

Related questions
Question
Ap Stats
Transcribed Image Text:A fisheries biologist studying whitefish in a Canadian Lake collected data on the length (in centimeters) and egg production for 25 female
fish. A scatter plot of her results and computer regression analysis of egg production versus fish length are given below. Note that number
of eggs is given in thousands (i.e., "40" means 40,000 eggs).
70
Number of eggs (thousands)
60
50
40
30-
20-
Predictor
Constant
4.2
·
What is the equation of the least-squares regression line?
O a Eggs = 25.55 + 5.392 (Length)
Ob Length = 25.55 +5.392 (Eggs)
Length = -142.74 +39.25 (Eggs)
O
Od
Eggs = -142.74 + 39.25 (Length)
Oe
Eggs = 39.25-142.74 (Length)
4.4 4.6 4.8 5.0 5.2
Fish length (cm)
T
P
25.55 -5.59 0.000
5.392 7.28 0.000
Coef
-142.74
Fish length 39.250
S = 6.75133 R-Sq 69.7%
SE Coef
R-Sq (adj) = 68.4%
Expert Solution
This question has been solved!
Explore an expertly crafted, step-by-step solution for a thorough understanding of key concepts.

This is a popular solution!

Trending now
This is a popular solution!

Step by step
Solved in 3 steps

Recommended textbooks for you
Trigonometry (MindTap Course List)
Trigonometry
ISBN:
9781305652224
Author:
Charles P. McKeague, Mark D. Turner
Publisher:
Cengage Learning

Glencoe Algebra 1, Student Edition, 9780079039897…
Algebra
ISBN:
9780079039897
Author:
Carter
Publisher:
McGraw Hill

Big Ideas Math A Bridge To Success Algebra 1: Stu…
Algebra
ISBN:
9781680331141
Author:
HOUGHTON MIFFLIN HARCOURT
Publisher:
Houghton Mifflin Harcourt
Trigonometry (MindTap Course List)
Trigonometry
ISBN:
9781305652224
Author:
Charles P. McKeague, Mark D. Turner
Publisher:
Cengage Learning
Glencoe Algebra 1, Student Edition, 9780079039897…
Algebra
ISBN:
9780079039897
Author:
Carter
Publisher:
McGraw Hill
Big Ideas Math A Bridge To Success Algebra 1: Stu…
Algebra
ISBN:
9781680331141
Author:
HOUGHTON MIFFLIN HARCOURT
Publisher:
Houghton Mifflin Harcourt