Fitting a straight line to a set of data yields the following prediction line. Complete (a) through (c) below. a. Interpret the meaning of the Y-intercept, bo. Choose the correct answer below. O A. The Y-intercept, bo = 8, implies that when the value of X is 0, the mean value of Y is 8. O B. The Y-intercept, bo = 8, implies that the average value of Y is 8. OC. The Y-intercept, bo =8, implies that for each increase of 1 unit in X, the value of Y is expected to increase by 8 units. OD. The Y-intercept, b, =2, implies that when the value of X is 0, the mean value of Y is 2. b. Interpret the meaning of the slope, b,. Choose the correct answer below. O A. The slope, b, =2, implies that for each increase of 1 unit in X, the value of Y is expected to increase by 2 units. O B. The slope, b; =2, implies that the average value of Y is 2. Oc. The slope, b, = 8, implies that for each increase of 1 unit in X, the value of Y is expected to increase by 8 units. O D. The slope, b, =2, implies that for each increase of 1 unit in X, the value of Y is expected to decrease by 2 units. c. Determine the preredicted value of Y for X=3. The predicted value is Y, =O
Fitting a straight line to a set of data yields the following prediction line. Complete (a) through (c) below. a. Interpret the meaning of the Y-intercept, bo. Choose the correct answer below. O A. The Y-intercept, bo = 8, implies that when the value of X is 0, the mean value of Y is 8. O B. The Y-intercept, bo = 8, implies that the average value of Y is 8. OC. The Y-intercept, bo =8, implies that for each increase of 1 unit in X, the value of Y is expected to increase by 8 units. OD. The Y-intercept, b, =2, implies that when the value of X is 0, the mean value of Y is 2. b. Interpret the meaning of the slope, b,. Choose the correct answer below. O A. The slope, b, =2, implies that for each increase of 1 unit in X, the value of Y is expected to increase by 2 units. O B. The slope, b; =2, implies that the average value of Y is 2. Oc. The slope, b, = 8, implies that for each increase of 1 unit in X, the value of Y is expected to increase by 8 units. O D. The slope, b, =2, implies that for each increase of 1 unit in X, the value of Y is expected to decrease by 2 units. c. Determine the preredicted value of Y for X=3. The predicted value is Y, =O

Glencoe Algebra 1, Student Edition, 9780079039897, 0079039898, 2018
18th Edition
ISBN:9780079039897
Author:Carter
Publisher:Carter
Chapter10: Statistics
Section10.5: Comparing Sets Of Data
Problem 26PFA

Related questions
Question
Please fill in the blanks and select the correct answers over the image provided. Thank you
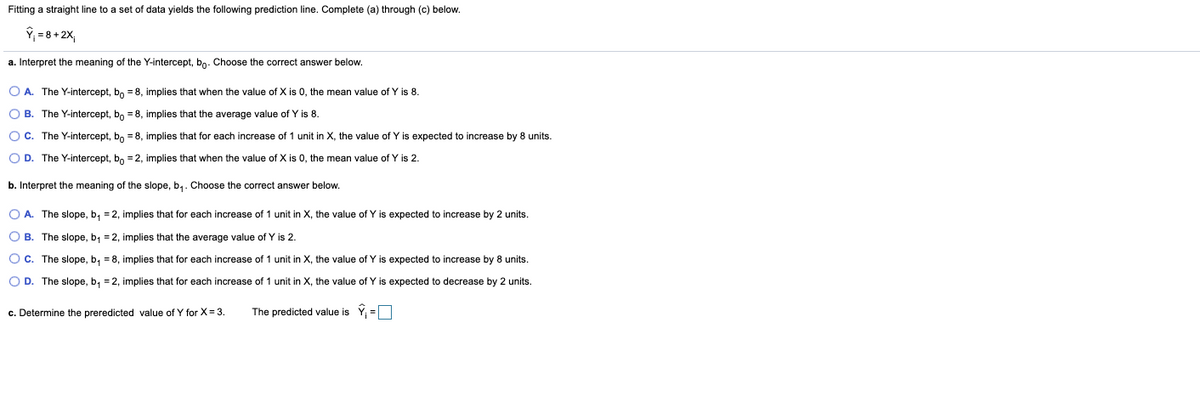
Transcribed Image Text:Fitting a straight line to a set of data yields the following prediction line. Complete (a) through (c) below.
ŷ; = 8+ 2X,
a. Interpret the meaning of the Y-intercept, bo. Choose the correct answer below.
O A. The Y-intercept, bo = 8, implies that when the value of X is 0, the mean value of Y is 8.
O B. The Y-intercept, b, = 8, implies that the average value of Y is 8.
OC. The Y-intercept, bo = 8, implies that for each increase of 1 unit in X, the value of Y is expected to increase by 8 units.
O D. The Y-intercept, bo = 2, implies that when the value of X is 0, the mean value of Y is 2.
b. Interpret the meaning of the slope, b,. Choose the correct answer below.
O A. The slope, b, = 2, implies that for each increase of 1 unit in X, the value of Y is expected to increase by 2 units.
O B. The slope, b, = 2, implies that the average value of Y is 2.
Oc. The slope, b, = 8, implies that for each increase of 1 unit in X, the value of Y is expected to increase by 8 units.
O D. The slope, b, = 2, implies that for each increase of 1 unit in X, the value of Y is expected to decrease by 2 units.
c. Determine the preredicted value of Y for X= 3.
The predicted value is Y =O
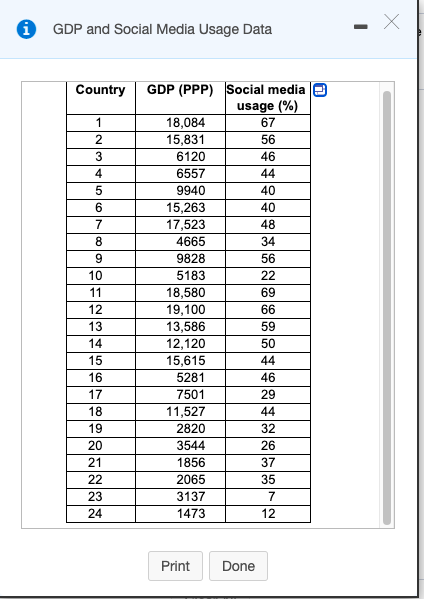
Transcribed Image Text:GDP and Social Media Usage Data
GDP (PPP) Social media e
usage (%)
67
Country
18,084
15,831
1
2
56
3
6120
46
4
6557
44
9940
40
15,263
40
17,523
48
4665
34
9
9828
56
10
5183
22
11
18,580
69
12
19,100
13,586
12,120
15,615
66
13
59
14
50
15
44
16
5281
46
17
7501
29
18
11,527
44
19
2820
32
20
3544
26
21
1856
37
22
2065
35
23
3137
7
24
1473
12
Print
Done
567 co
Expert Solution
This question has been solved!
Explore an expertly crafted, step-by-step solution for a thorough understanding of key concepts.

This is a popular solution!

Trending now
This is a popular solution!

Step by step
Solved in 2 steps

Knowledge Booster


Learn more about
Need a deep-dive on the concept behind this application? Look no further. Learn more about this topic, statistics and related others by exploring similar questions and additional content below.Recommended textbooks for you
Glencoe Algebra 1, Student Edition, 9780079039897…
Algebra
ISBN:
9780079039897
Author:
Carter
Publisher:
McGraw Hill

Algebra: Structure And Method, Book 1
Algebra
ISBN:
9780395977224
Author:
Richard G. Brown, Mary P. Dolciani, Robert H. Sorgenfrey, William L. Cole
Publisher:
McDougal Littell

Holt Mcdougal Larson Pre-algebra: Student Edition…
Algebra
ISBN:
9780547587776
Author:
HOLT MCDOUGAL
Publisher:
HOLT MCDOUGAL
Glencoe Algebra 1, Student Edition, 9780079039897…
Algebra
ISBN:
9780079039897
Author:
Carter
Publisher:
McGraw Hill
Algebra: Structure And Method, Book 1
Algebra
ISBN:
9780395977224
Author:
Richard G. Brown, Mary P. Dolciani, Robert H. Sorgenfrey, William L. Cole
Publisher:
McDougal Littell
Holt Mcdougal Larson Pre-algebra: Student Edition…
Algebra
ISBN:
9780547587776
Author:
HOLT MCDOUGAL
Publisher:
HOLT MCDOUGAL

Functions and Change: A Modeling Approach to Coll…
Algebra
ISBN:
9781337111348
Author:
Bruce Crauder, Benny Evans, Alan Noell
Publisher:
Cengage Learning