Use the graphical solution procedure to find the optimal solution. b. Assume that the objective function coefficient for X changes from 8 to 6. Does the optimal solution change? Use the graphical solution procedure to find the new optimal solution. Assume that the objective function coefficient for X remains 8, but the objective func- tion coefficient for Y changes from 12 to 6. Does the optimal solution change? Use the graphical solution procedure to find the new optimal solution. a. с.
Use the graphical solution procedure to find the optimal solution. b. Assume that the objective function coefficient for X changes from 8 to 6. Does the optimal solution change? Use the graphical solution procedure to find the new optimal solution. Assume that the objective function coefficient for X remains 8, but the objective func- tion coefficient for Y changes from 12 to 6. Does the optimal solution change? Use the graphical solution procedure to find the new optimal solution. a. с.

Practical Management Science
6th Edition
ISBN:9781337406659
Author:WINSTON, Wayne L.
Publisher:WINSTON, Wayne L.
Chapter7: Nonlinear Optimization Models
Section7.7: Portfolio Optimization Models
Problem 41P

Related questions
Question
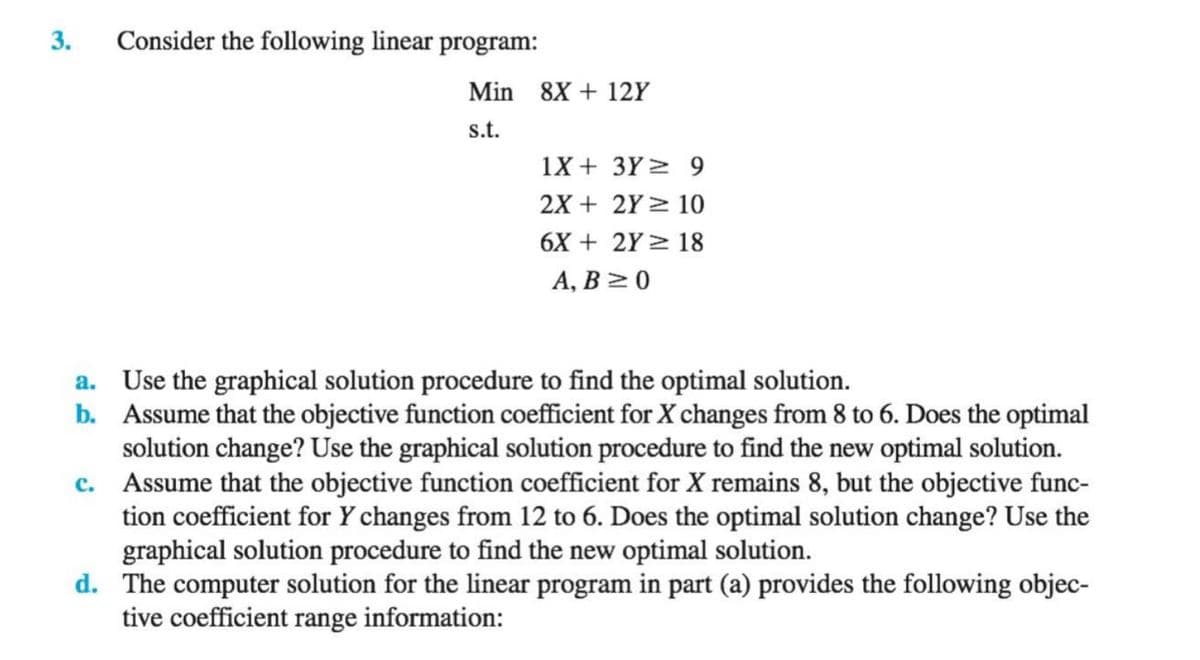
Transcribed Image Text:3.
Consider the following linear program:
Min 8X + 12Y
s.t.
1X + 3Y > 9
2X + 2Y > 10
6X + 2Y > 18
А, В 2 0
a. Use the graphical solution procedure to find the optimal solution.
b. Assume that the objective function coefficient for X changes from 8 to 6. Does the optimal
solution change? Use the graphical solution procedure to find the new optimal solution.
c. Assume that the objective function coefficient for X remains 8, but the objective func-
tion coefficient for Y changes from 12 to 6. Does the optimal solution change? Use the
graphical solution procedure to find the new optimal solution.
d. The computer solution for the linear program in part (a) provides the following objec-
tive coefficient range information:
Expert Solution
This question has been solved!
Explore an expertly crafted, step-by-step solution for a thorough understanding of key concepts.

This is a popular solution!

Trending now
This is a popular solution!

Step by step
Solved in 5 steps with 11 images

Follow-up Questions
Read through expert solutions to related follow-up questions below.
Follow-up Question
Follow up for part d)

Transcribed Image Text:3.
Consider the following linear program:
Min 8X + 12Y
s.t.
1X + 3Y > 9
2X + 2Y > 10
6X + 2Y > 18
А, В 2 0
a. Use the graphical solution procedure to find the optimal solution.
b. Assume that the objective function coefficient for X changes from 8 to 6. Does the optimal
solution change? Use the graphical solution procedure to find the new optimal solution.
c. Assume that the objective function coefficient for X remains 8, but the objective func-
tion coefficient for Y changes from 12 to 6. Does the optimal solution change? Use the
graphical solution procedure to find the new optimal solution.
d. The computer solution for the linear program in part (a) provides the following objec-
tive coefficient range information:
Solution
Recommended textbooks for you
Practical Management Science
Operations Management
ISBN:
9781337406659
Author:
WINSTON, Wayne L.
Publisher:
Cengage,
Practical Management Science
Operations Management
ISBN:
9781337406659
Author:
WINSTON, Wayne L.
Publisher:
Cengage,