Suppose actual quarterly sales (in thousands) for Year 5 are 193, 163, 207, and 105 respectively. Assuming there is no trend, forecast sales for the four quarters of Year 5. Use seasonal indexes (rounded to 4 decimal places) from Part A. Report forecast answers as integers accurate to the nearest thousand. Quarter 1 forecast = thousand Quarter 2 forecast = thousand Quarter 3 forecast = thousand Quarter 4 forecast = thousand Calculate the mean absolute percent error (MAPE) for the four forecasts. Use the integer forecast values you reported above. Report MAPE as percent accurate to 2 decimal places. Do not round intermediate values. МАРЕ 3D %
Suppose actual quarterly sales (in thousands) for Year 5 are 193, 163, 207, and 105 respectively. Assuming there is no trend, forecast sales for the four quarters of Year 5. Use seasonal indexes (rounded to 4 decimal places) from Part A. Report forecast answers as integers accurate to the nearest thousand. Quarter 1 forecast = thousand Quarter 2 forecast = thousand Quarter 3 forecast = thousand Quarter 4 forecast = thousand Calculate the mean absolute percent error (MAPE) for the four forecasts. Use the integer forecast values you reported above. Report MAPE as percent accurate to 2 decimal places. Do not round intermediate values. МАРЕ 3D %

Practical Management Science
6th Edition
ISBN:9781337406659
Author:WINSTON, Wayne L.
Publisher:WINSTON, Wayne L.
Chapter13: Regression And Forecasting Models
Section13.6: Moving Averages Models
Problem 20P: The file P13_20.xlsx contains the monthly sales of iPod cases at an electronics store for a two-year...

Related questions
Question
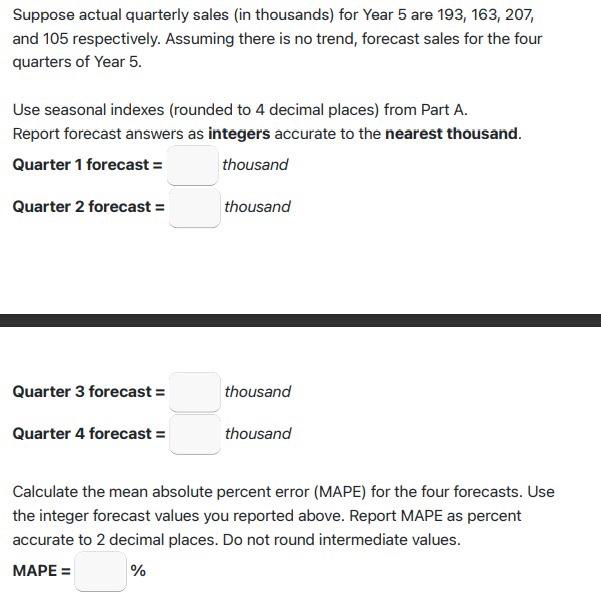
Transcribed Image Text:Suppose actual quarterly sales (in thousands) for Year 5 are 193, 163, 207,
and 105 respectively. Assuming there is no trend, forecast sales for the four
quarters of Year 5.
Use seasonal indexes (rounded to 4 decimal places) from Part A.
Report forecast answers as integers accurate to the nearest thousand.
Quarter 1 forecast =
thousand
Quarter 2 forecast =
thousand
Quarter 3 forecast =
thousand
Quarter 4 forecast =
thousand
Calculate the mean absolute percent error (MAPE) for the four forecasts. Use
the integer forecast values you reported above. Report MAPE as percent
accurate to 2 decimal places. Do not round intermediate values.
МАРЕ 3D
%
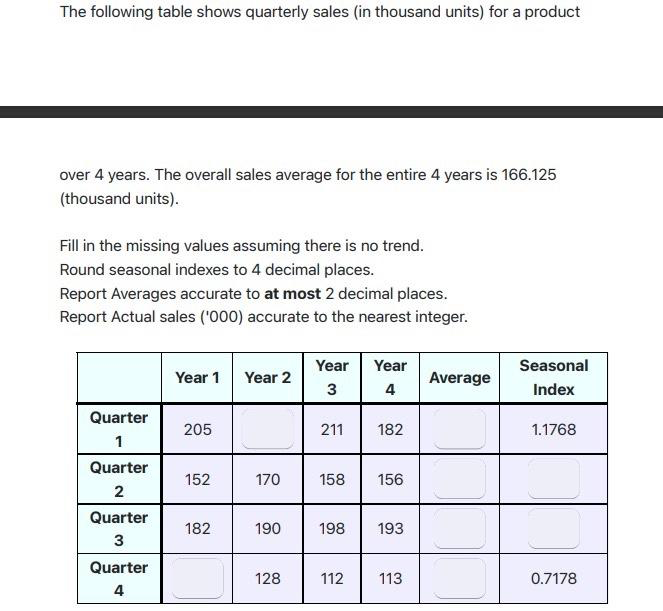
Transcribed Image Text:The following table shows quarterly sales (in thousand units) for a product
over 4 years. The overall sales average for the entire 4 years is 166.125
(thousand units).
Fill in the missing values assuming there is no trend.
Round seasonal indexes to 4 decimal places.
Report Averages accurate to at most 2 decimal places.
Report Actual sales ('000) accurate to the nearest integer.
Year
Year
Seasonal
Year 1
Year 2
Average
4
Index
Quarter
205
211
182
1.1768
1
Quarter
152
170
158
156
2
Quarter
182
190
198
193
3
Quarter
128
112
113
0.7178
4
Expert Solution
This question has been solved!
Explore an expertly crafted, step-by-step solution for a thorough understanding of key concepts.

Step by step
Solved in 5 steps with 1 images

Recommended textbooks for you
Practical Management Science
Operations Management
ISBN:
9781337406659
Author:
WINSTON, Wayne L.
Publisher:
Cengage,
Practical Management Science
Operations Management
ISBN:
9781337406659
Author:
WINSTON, Wayne L.
Publisher:
Cengage,