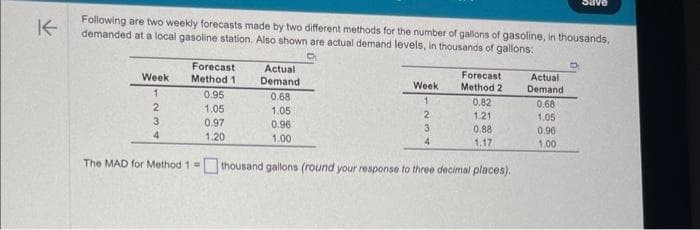
Following are two weekly forecasts made by two different methods for the number of gallons of gasoline, in thousands, demanded at a local gasoline station. Also shown are actual demand levels, in thousands of gallons: d Week 1 2 3 4 Forecast Method 1 0.95 1.05 0.97 1.20 Actual Demand 0.68 1.05 0.96 1.00 Week 1 2 3 4 Forecast Method 2 0.82 1.21 0.88 1.17 The MAD for Method 1 = thousand gallons (round your response to three decimal places). Actual Demand 0.68 1.05 0.96 1.00
Q: Twelve samples, each containing five parts, were taken from a process that produces steel rods at…
A: Given-
Q: a bread manufacturer relies on maintenance employees to keep its rather quite old production…
A: In this situation, the maintenance employees have significant sources of power, including expert…
Q: Milestone Name Hiring of and Communicating with Professionals and their Teams Define structural…
A: The above-given question is to prepare a Bar Milestone chart of the given data. A milestone chart…
Q: son Manufacturing, in Gainesville, Florida, wants to arrange its four work centers so as to minimize…
A: Given: The distance between work centers: AB=30 AC=60 AD=90 BC=30 BD=60 CD=30
Q: What is the concerns, their importance and their challenges of Sustainable Development
A: Development that meets the requirements of the present without sacrificing the potential of future…
Q: What is the structured approach to process analysis?
A: Since you have posted multiple questions, we will provide the solution only to the first question as…
Q: Your Lego furniture company makes Tables and Chairs. Below, you are given the starting inventory,…
A: To find: The number of chair and table for maximize revenue. Given: For scenario 4 the large wood…
Q: There are a lot of different understandings what defines "Quality". Please discuss these different…
A: Quality is a multifaceted concept that can be viewed in different ways depending on the context and…
Q: Weekday Work Schedule Servers Start Time End Time 10:30 AM 2:00 PM 11:00 AM 3:00 PM 12:00 PM 4:00 PM…
A: Develop a spreadsheet as shown below and use excel solver to find the optimal schedule of…
Q: Why is C the best illustration of a differentiation strategy?
A: The cost of getting any good or service is known as the price. Cost is the sum spent on making and…
Q: Healthy Foods is a restaurant that is located in the centre of Hana Town. It provides a variety of…
A:
Q: For small business startups, why should new entrepreneurs lease major equipment and premises instead…
A: New entrepreneurs should consider leasing major equipment and premises instead of purchasing them is…
Q: Consider a manufacturing process depicted by the following flowchart. A1 A2 B: 4 minutes A3 Each of…
A: Given process time of the operators- A1, A2, and A3: 20 minutes B: 4 minutes C1 and C2: 2 minutes.
Q: What is the total crashing cost? S 051?$(5 (Enter your response as a whole number)
A: A network diagram shows the sequence of the task that is done to complete a project. It usually…
Q: Consider a four-step serial process with the number of workers at each step and processing times…
A: A business process consist of a sequence of activities that contributes to the process of creating a…
Q: Compute the net quantities needed if there are 25 of the base and 75 of the clamp in stock. Base:…
A: Here, First I would construct the product tree from the given information, Here, I would assemble…
Q: What are the steps you need to take to ensure that your opening day will not bomb? (If you were to…
A: Opening a new shop in an area can be an exciting but also challenging experience, particularly if…
Q: Outline how SAP ERP modifies the relationships between people, businesses, and projects
A: How the deployment of an ERP system may significantly impact a firm's runs. Popular software called…
Q: A resource-based strategy A) is often based on cross-department combinations of intellectual…
A: Here, it is an MCQ question, I would select the most appropriate answer for the question related to…
Q: A dairy company gets milk from two dairies and then blends the milk to get the desired amount of…
A: Given data is Butterfat from dairy 1 = 3.7% Butterfat from dairy 2 = 2.9% Cost of milk from dairy 1…
Q: 1. William Beville's computer training school, in Richmond, stocks workbooks with the following…
A: EOQ is Economic order quantity. It is calculated the optimal order quantity. Annual demand (D) =…
Q: Kelle Carpet and Trim installs carpet in commercial offices. Peter Kelle has been very concerned…
A: Formulae used: To determine the expected Time duration : Te =(a+4m+b)6Where,a= Optimistic timem=…
Q: ▪ Ordering cost (S) = $55.00/order ▪ Holding cost (H) = $2.50/unit/year Lead time (L) = 3 week(s)…
A: Optimal order quantity is Economic order quantity. It is determined by following way: Optimal order…
Q: 11.) List the characteristics of a good interviewer. Which charaeteristics do you think you need to…
A: As per our guidelines, we are supposed to answer only first question if multiple questions are…
Q: A project to build a new bridge seems to be going very well since the project is well ahead of…
A: I have arranged the given data in the form of a table: Actual progress 64% Planned Progress 53%…
Q: illustrate an organizational chat The chart shows a clear chain of command, with the General…
A: General Manager…
Q: The accompanying table shows the activities, times, and sequences required: ACTIVITY INMEDIATE…
A: Ans) Data is given in table First Step is to make the AON Diagram.
Q: Users of the internet have the opportunity to get two separate sorts of services via the usage of…
A: It is true that different characteristics can distinguish a service apart from its competitors, but…
Q: Instructions Considering the indirect approach to delivering bad news answer for the four questions…
A: Correct communication is crucial for effective communication in any setting, whether it's personal…
Q: What are the major strengths of job control unionism? The major weaknesses? Has job control unionism…
A: Job control unionism fundamentally alludes to the coming about design relating to conventional…
Q: For each of the following programs: (1) Sketch the feasible region of the program and the direction…
A: Objective Functions and Constraints: Based on the given details, the objective…
Q: The Yum and Yee food truck near the business school serves customers during lunch hour by taking…
A: Given data: Time to cook one order=6.5 minutesAn process time order require additional time=0.5…
Q: What arguments does quality control make in favor of e-commerce-focused native Android and iOS apps?
A: E-commerce (electronic commerce) refers to the buying and selling of goods and services over the…
Q: You own a wheat warehouse with a capacity of 20 bushels. At the beginning of month 1, you have 6…
A: Decision Variable: Suppose-Xi= Initial stock of wheatYi= Amount of wheat soldZi = Amount of wheat…
Q: Gestat, inc uses a kanban system in its automobile production facility in Germany. This facility…
A: Given- Processing time per part= 150 secondsContainer size = 30 partsAverage waiting time per…
Q: Among all of the stakeholders in an office project, which is NOT a reason to do a market study?…
A: A market study is an analysis process that mainly focuses on identifying the demand and supply…
Q: From plants Existing plants Atlanta Tulsa Proposed locations New Orleans Houston Forecast demand To…
A: Decision Variables: Suppose-Xij be the quantities transported from plant i to distribution center j…
Q: Consider an assembly line with 3 sequential operations A, B, and C with processing times per part of…
A: Production is the combination of the inputs to have the required output. It includes various tools,…
Q: The production process shown below consists of five stages. The numbers in parentheses are the times…
A: CONCEPT- A bottleneck is a place of blockage in a production framework that eases back or stops…
Q: So how do these two fields of study diverge from one another? How, for instance, are project…
A: project management implies the most common way of driving a group to hit goals or complete…
Q: The New England Cheese Company produces two cheese spreads by blending mild cheddar cheese with…
A: 1 pound = 16 ounces Regular container has 80% mild cheddar and 20% extra sharp Cost for regular…
Q: Consider a firm like Zara that has developed production capabilities with very short replenishment…
A: Zara's production capabilities with short replenishment lead times are valuable for the two its…
Q: Prove that The critical path method solves the parallel precedenceconstrained scheduling problem in…
A: The critical path method (CPM) is a project management technique used to schedule, organize, and…
Q: Discuss four (4) major cost drivers that would play a role in determining John’s company’s costs in…
A: John is the proprietor of a manufacturing business in the Caribbean that has developed over time and…
Q: The R&D department is planning to bid on a large project for the development of a new communication…
A: Forward Pass:Early Start (ES) = Max EF value from immediate Predecessor(s)Early Finish (EF)= ES +…
Q: Enumerate and explain some organizational values or culture
A: Corporate values and culture are the tenets and beliefs that shape a company's character and…
Q: Question Six: The Financial Statement of your company shows that your profit is $20,000 (as shown in…
A: Given-
Q: The following diagram represents a process where two components are made at stations A1 and A2 (one…
A: The average hourly output of the process determines the number of units that can be or are being…
Q: Given the information in the following table: Activity IPAS A B C D E ● ● A A B,C D Draw the AOA…
A: Given- Activity Immediate Predecessors A - B A C A D B,C E D
Trending now
This is a popular solution!
Step by step
Solved in 2 steps
- The file P13_42.xlsx contains monthly data on consumer revolving credit (in millions of dollars) through credit unions. a. Use these data to forecast consumer revolving credit through credit unions for the next 12 months. Do it in two ways. First, fit an exponential trend to the series. Second, use Holts method with optimized smoothing constants. b. Which of these two methods appears to provide the best forecasts? Answer by comparing their MAPE values.The file P13_28.xlsx contains monthly retail sales of U.S. liquor stores. a. Is seasonality present in these data? If so, characterize the seasonality pattern. b. Use Winters method to forecast this series with smoothing constants = = 0.1 and = 0.3. Does the forecast series seem to track the seasonal pattern well? What are your forecasts for the next 12 months?The file P13_26.xlsx contains the monthly number of airline tickets sold by the CareFree Travel Agency. a. Create a time series chart of the data. Based on what you see, which of the exponential smoothing models do you think will provide the best forecasting model? Why? b. Use simple exponential smoothing to forecast these data, using a smoothing constant of 0.1. c. Repeat part b, but search for the smoothing constant that makes RMSE as small as possible. Does it make much of an improvement over the model in part b?
- The file P13_29.xlsx contains monthly time series data for total U.S. retail sales of building materials (which includes retail sales of building materials, hardware and garden supply stores, and mobile home dealers). a. Is seasonality present in these data? If so, characterize the seasonality pattern. b. Use Winters method to forecast this series with smoothing constants = = 0.1 and = 0.3. Does the forecast series seem to track the seasonal pattern well? What are your forecasts for the next 12 months?The Baker Company wants to develop a budget to predict how overhead costs vary with activity levels. Management is trying to decide whether direct labor hours (DLH) or units produced is the better measure of activity for the firm. Monthly data for the preceding 24 months appear in the file P13_40.xlsx. Use regression analysis to determine which measure, DLH or Units (or both), should be used for the budget. How would the regression equation be used to obtain the budget for the firms overhead costs?The file P13_27.xlsx contains yearly data on the proportion of Americans under the age of 18 living below the poverty level. a. Create a time series chart of the data. Based on what you see, which of the exponential smoothing models do you think will provide the best forecasting model? Why? b. Use simple exponential smoothing to forecast these data, using a smoothing constant of 0.1. c. Repeat part b, but search for the smoothing constant that makes RMSE as small as possible. Create a chart of the series with the forecasts superimposed from this optimal smoothing constant. Does it make much of an improvement over the model in part b? d. Write a short report to summarize your results. Considering the chart in part c, would you say the forecasts are good?
- Stock market analysts are continually looking for reliable predictors of stock prices. Consider the problem of modeling the price per share of electric utility stocks (Y). Two variables thought to influence this stock price are return on average equity (X1) and annual dividend rate (X2). The stock price, returns on equity, and dividend rates on a randomly selected day for 16 electric utility stocks are provided in the file P13_15.xlsx. Estimate a multiple regression equation using the given data. Interpret each of the estimated regression coefficients. Also, interpret the standard error of estimate and the R-square value for these data.The file P13_02.xlsx contains five years of monthly data on sales (number of units sold) for a particular company. The company suspects that except for random noise, its sales are growing by a constant percentage each month and will continue to do so for at least the near future. a. Explain briefly whether the plot of the series visually supports the companys suspicion. b. By what percentage are sales increasing each month? c. What is the MAPE for the forecast model in part b? In words, what does it measure? Considering its magnitude, does the model seem to be doing a good job? d. In words, how does the model make forecasts for future months? Specifically, given the forecast value for the last month in the data set, what simple arithmetic could you use to obtain forecasts for the next few months?The file P13_22.xlsx contains total monthly U.S. retail sales data. While holding out the final six months of observations for validation purposes, use the method of moving averages with a carefully chosen span to forecast U.S. retail sales in the next year. Comment on the performance of your model. What makes this time series more challenging to forecast?
- The file P13_19.xlsx contains the weekly sales of a particular brand of paper towels at a supermarket for a one-year period. a. Using a span of 3, forecast the sales of this product for the next 10 weeks with the moving averages method. How well does this method with span 3 forecast the known observations in this series? b. Repeat part a with a span of 10. c. Which of these two spans appears to be more appropriate? Justify your choice.The file P13_25.xlsx contains the quarterly numbers of applications for home mortgage loans at a branch office of Northern Central Bank. a. Create a time series chart of the data. Based on what you see, which of the exponential smoothing models do you think will provide the best forecasting model? Why? b. Use simple exponential smoothing to forecast these data, using a smoothing constant of 0.1. c. Repeat part b, but search for the smoothing constant that makes RMSE as small as possible. Does it make much of an improvement over the model in part b? Is it guaranteed to produce better forecasts for the future?A small computer chip manufacturer wants to forecast monthly ozperating costs as a function of the number of units produced during a month. The company has collected the 16 months of data in the file P13_34.xlsx. a. Determine an equation that can be used to predict monthly production costs from units produced. Are there any outliers? b. How could the regression line obtained in part a be used to determine whether the company was efficient or inefficient during any particular month?