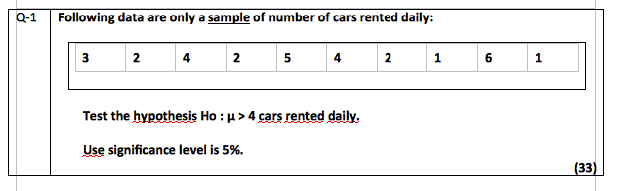
Following data are only a sample of number of cars rented daily: 3 2 4 2 5 4 2 6 1 Test the hypothesis Ho : µ> 4 cars rented daily. Use significance level is 5%. (33)


Q: Consider the following set of samples obtained from two normally distributed populations whose…
A: Independent events are those events whose occurrence is not dependent on any other event. If the…
Q: Suppose samples of soil around homes in an area were obtained and the lead level in each was…
A: Empirical rule: The Empirical Rule states that 99.7% of data observed following a normal…
Q: Use the effect size 0.47 to answer the following regarding a test of H0: mu1-mu2= 0 (using the .05…
A: Effect size, d = 0.47 Here, our null hypothesis is, H0:δ=0 v.s. H1:δ≠0 n1 = 50 and n2 = 150. Level…
Q: The following information is obtained from two independent samples selected from two populations. n…
A: Given,n1=250n2=240x¯1=5.35x¯2=4.42σ1=1.65σ2=1.63
Q: 8. Is the given correlation coefficient statistically significant at the specified level of…
A: It is provided that, the sample size (n) = 14, the correlation coefficient (r) = 0.703To test the…
Q: Use the effect size 0.47 to answer the following regarding a test of H0: mu1-mu2= 0 (using the .05…
A: The following information is available in the question Effect size=0.47μ1-μ2=0n1=75n2=125
Q: Listed below are the lead concentrations in ug/g measured in different traditional medicines. Use a…
A: The data set is: 19.5 2.5 14.5 3.5 22 12.5 10 13.5 10.5 22.5
Q: The data below are from an independent-measures experiment comparing three different treatment…
A: Given Number of treatment 3 Number of observation 12
Q: 9. Given the linear correlation coefficient r and the sample size n, determine the critical values…
A: The level of significance is 0.05.
Q: Listed below are the lead concentrations in pg/g measured in different traditional medicines. Use a…
A: Given,sample size(n)=10sample…
Q: Listed below are the lead concentrations in µg/g measured in different traditional medicines. Use a…
A: Correct answer is (C)
Q: Which sample result would provide evidence that there isan association between two quantitative…
A: In the simple linear regression, the test for slope tests the significance of the slope of the…
Q: Consider the following data related to the discrete random variable X: x 7 82 49 P(x)…
A: Given, Probability distribution of random variable X. We have to find out the variance of X, i.e…
Q: Prior to assessment of the outcome, the researchers did a manipulation check. Members of Groups 1…
A: It is given that the F-test statistic is 184.29, the degrees of freedom for first and second groups…
Q: Listed below are the lead concentrations in ug/g measured in different traditional medicines. Use a…
A: Denote μ as the population mean lead concentration. The claim is that, the the mean lead…
Q: Correct answer plz
A:
Q: The data below are from an independent-measures experiment comparing three different treatment…
A: a.Here the significance of mean difference among the three treatments are compared so ANOVA is used…
Q: Use the following information to answer the question. A random sample of 54 students from Cabrillo…
A: we have given that n=54 , mu=20 , sigma =5 and sample mean =21 and level of significance…
Q: Samples of starting annual salaries for individuals entering the public accounting and financial…
A: a).Given, n1=10n2=10α=0.05 The hypothesis to be tested here is- H0: There is no difference between…
Q: The following data summarize the results from an independent-measures study comparing three…
A: Null hypothesis: There is no significant differences among the three treatment means. Alternative…
Q: Given the information in the following ANOVA table, compute the sample correlation coefficient.…
A: Given that
Q: Listed below are the lead concentrations in ug/g measured in different traditional medicines. Use a…
A:
Q: Listed below are the lead concentrations in ug/g measured in different traditional medicines. Use a…
A: The sample mean and standard deviation are,
Q: A firm in Lebanon has developed a chemical solution that can be added to car gasoline which they…
A: Since you have asked multiple question, we will solve the first question for you. If youwant any…
Q: Conduct a hypothesis test using an alpha level of α = .01 to determine if the correlation is…
A: Given that the correlation between Job satisfaction and work-life balance is given by r = 0.69…
Q: In a test of Ho: H= 100 against H:u 100, a sample of size 10 produces a sample mean of 103 and a…
A: given H0 : μ = 100 H1 : μ ≠100 alpha = 5% p value = 0.08
Q: For which of the following pairs of significance levels and pp-values are the results statistically…
A: Solution: State the hypotheses. Null hypothesis: H0: The results are not statistically significant.…
Q: Two independent samples of 8 and 7 items respectively have the following values of the variables:…
A: Please note that as per our company's guidelines if multiple questions are posted we can answer only…
Q: Question 12: Test the claim that the proportion of men who own cats is larger than 50% at the .005…
A:
Q: Consider the following hypothesis statement using α=0.01 and data from two independent samples.…
A: Introduction: Denote μ1, μ2 as the true population means. The null and alternative hypotheses are as…
Q: 1: Two random samples taken from two normal populations yielded the following information: Sample…
A: Given data:
Q: Suppose we have the following data collected from three randomly-selected counties: 1.What is the…
A: Solution-: Given data: Let, x= % with HS Degree and y=% in Poverty Country xi yi A 90 5 B…
Q: An experiment was conducted to investigate the effects of the concentrations of sulfuric acid…
A:
Q: Assuming the populations of measurements to be ap- proximately normally distributed, test the…
A: A (X) B (Y) (X-xbar)^2 (y-ybar)^2 0.86 0.87 0.01310 0.03956 0.82 0.74 0.00554 0.00475 0.75…
Q: The data below are from an independent-measures experiment comparing three different treatment…
A: Given:
Q: A Z-test for single population mean is conducted with Ha: µ < 10, at significance level of 0.05, The…
A:
Q: The data below are from an independent-measures experiment comparing three different treatment…
A: Given table :
Q: Independent random samples of 17 sophomores and 13 juniors attending a large university yield the…
A: Given Data : For Sample 1 x̄1 = 2.75 s1 = 0.31 n1 = 13 For Sample 2…
Q: Following is the rating of marketing aggressivity (X) and sales performance (Y) of 8 sales staffs in…
A: Here we'll define null hypothesis and alternative hypothesis for the given statement and data.
Q: Suppose samples of soil around homes in an area were obtained and the lead level in each was…
A:
Q: 10 The following table shows the frequency distribution of the number of children at a childcare…
A:
Q: For which of the following pairs of significance levels and p-values are the results statistically…
A: We reject the null hypothesis when the p-value is less than the level of significance.
Q: Under random assignment, is beta 1^ an unbiased estimator of the average treatment effect (ATE)? ATE…
A: Given information: It is asked to find the unbiased estimator of the average treatment effect.
Q: The following data are from a study comparing three groups of college students. The information…
A: Given data
Q: 7. The following paired random samples are measurements of the heat-producing capacity (in millions…
A: We want to test the hypothesis by using difference between two means
Q: A. CONSIDER that the data is CORRELATED use alpha .05. Provide the following: 1. Number of…
A: Since you have posted a question with multiple subparts, we will solve first three subparts for you.…
Q: Consider the hypothesis test below. Ho: P₁-P2 ≤0 H₂ : P₁ - P2 > 0 The following results are for…
A:
Q: Listed below are the lead concentrations in ug/g measured in different traditional medicines. Use a…
A: Given data is ,18 , 4.5 , 6.5 , 10 , 15.5 , 22 , 13.5 , 8.5 , 17 , 18sample size(n)=10sample…
Q: Consider the following hypothesis statement using a = 0.05 and data from two independent samples.…
A:
Q: Refer to the below table. Using an alpha = 0.05, test the claim that IQ scores are the same for…
A: The null and alternative hypotheses are shown below: H0: The IQ scores are the same for children in…
Please solve this question with details asap. Thank you so much!!

Step by step
Solved in 4 steps with 2 images


- Morgan City Fire Chief Sidney Pyro is concerned about the low efficiency scores that his firefighters receive at the state testing institute. Chief Pyro believes that these scores result because some firefighters are not in good physical condition. Pyro orders 75 randomly selected firefighters to participate in an hour of exercise per day. Another 200 firefighters have no required exercise. After 60 days, all firefighters are tested again by the state. Chief Pyro collects the data and performs a two-sample independent t-test by using SPSS to examine if there is a statistically significant difference between the treatment and control groups; the SPSS results are shown in the table below. Group Statistics Groups N Mean Std. Deviation Std. Error Mean Test Scores Treatment 75 74.5 31.4 3.6 Control 200 70.6 26.3 1.9 a. Formulate a null and research hypothesis: H0: H1: Collect all the necessary data: Mean score of the treatment group:…Morgan City Fire Chief Sidney Pyro is concerned about the low efficiency scores that his firefighters receive at the state testing institute. Chief Pyro believes that these scores result because some firefighters are not in good physical condition. Pyro orders 75 randomly selected firefighters to participate in an hour of exercise per day. Another 200 firefighters have no required exercise. After 60 days, all firefighters are tested again by the state. Chief Pyro collects the data and performs a two-sample independent t-test by using SPSS to examine if there is a statistically significant difference between the treatment and control groups; the SPSS results are shown in the table below. Groups N Mean Std. Deviation Std. Error Mean Test Scores Treatment 75 74.5 31.4 3.6 Control 200 70.6 26.3 1.9 Formulate a null and research hypothesis: H0: H1: Collect all the necessary data: Mean score of the treatment group: Mean score of the control group: Sample size of the…Hypthesis testing In a 2011 National Institute on Alcohol Abuse and Alcoholism survey, 33% of American adults said that they had never consumed alcohol (USA TODAY, November 17, 2011). Suppose this result is true for the 2011 population of American adults. In a recent random sample of 2300 American adults, 35% said that they have never consumed alcohol. Using a 5% significance level, can you conclude that the current percentage of American adults who have never consumed alcohol is 33%?
- A study is made of residents in Phoenix and its suburbs concerning the proportion of residents who subscribe to Sporting News. A random sample of n1 = 86 urban residents showed that r1 = 13 subscribed, and a random sample of n2 = 95 suburban residents showed that r2 = 20 subscribed. Does this indicate that a higher proportion of suburban residents subscribe to Sporting News? Use a 5% level of significance. What are we testing in this problem? single meandifference of proportions single proportiondifference of meanspaired difference (a) What is the level of significance?State the null and alternate hypotheses. H0: p1 < p2; H1: p1 = p2H0: p1 = p2; H1: p1 > p2 H0: p1 = p2; H1: p1 < p2H0: p1 = p2; H1: p1 ≠ p2 (b) What sampling distribution will you use? What assumptions are you making? The Student's t. We assume the population distributions are approximately normal.The standard normal. The number of trials is sufficiently large. The Student's t. The number of…Testing the difference between proportions. Many elementary school students in a school district currently have ear infections. A random sample of children in two different schools found that 15 of 42 at one school and 22 of 40 at the other have ear infections. At the .05 level of significance, is there sufficient evidence to support the claim that a difference exists between the proportions of students who have ear infections at the two schools?
