following dotplots represent the heights, measured to the nearest cm, of 14 women Women's heights o 00 150 170 175 18o 180 155 160 165 185 Height (cm) Men's heights 0o o o 150 155 160 165 170 175 180 185 Height (cm) ose the two options from the list below that are true. ct one or more: The ranges of the two datasets indicate there is more variation in the heights of the the men. If the men's outlier is excluded, then the heights of the women are more densely pa median than the heights of the men. The range of heights of the men is less than the range of heights of the women.
following dotplots represent the heights, measured to the nearest cm, of 14 women Women's heights o 00 150 170 175 18o 180 155 160 165 185 Height (cm) Men's heights 0o o o 150 155 160 165 170 175 180 185 Height (cm) ose the two options from the list below that are true. ct one or more: The ranges of the two datasets indicate there is more variation in the heights of the the men. If the men's outlier is excluded, then the heights of the women are more densely pa median than the heights of the men. The range of heights of the men is less than the range of heights of the women.

Glencoe Algebra 1, Student Edition, 9780079039897, 0079039898, 2018
18th Edition
ISBN:9780079039897
Author:Carter
Publisher:Carter
Chapter10: Statistics
Section10.4: Distributions Of Data
Problem 19PFA

Related questions
Question
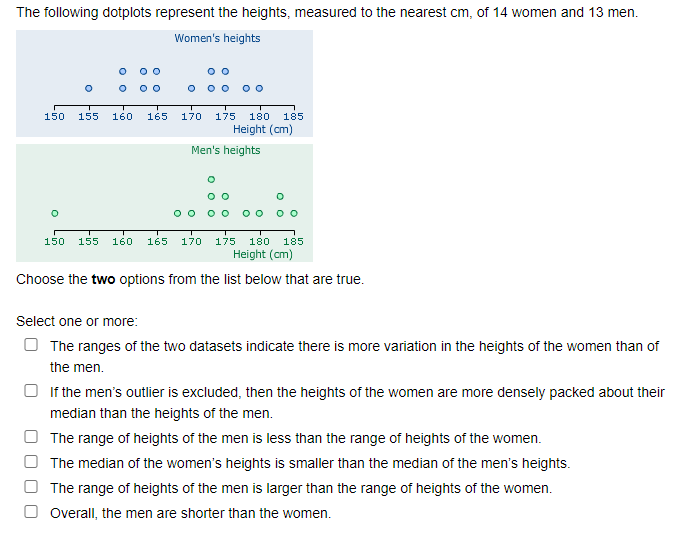
Transcribed Image Text:The following dotplots represent the heights, measured to the nearest cm, of 14 women and 13 men.
Women's heights
150
155
160
165
170
175
180
185
Height (cm)
Men's heights
150
155
160
165
170
175
180
185
Height (cm)
Choose the two options from the list below that are true.
Select one or more:
O The ranges of the two datasets indicate there is more variation in the heights of the women than of
the men.
If the men's outlier is excluded, then the heights of the women are more densely packed about their
median than the heights of the men.
O The range of heights of the men is less than the range of heights of the women.
The median of the women's heights is smaller than the median of the men's heights.
O The range of heights of the men is larger than the range of heights of the women.
O overall, the men are shorter than the women.
Expert Solution
This question has been solved!
Explore an expertly crafted, step-by-step solution for a thorough understanding of key concepts.

Step by step
Solved in 5 steps with 3 images

Recommended textbooks for you
Glencoe Algebra 1, Student Edition, 9780079039897…
Algebra
ISBN:
9780079039897
Author:
Carter
Publisher:
McGraw Hill
Glencoe Algebra 1, Student Edition, 9780079039897…
Algebra
ISBN:
9780079039897
Author:
Carter
Publisher:
McGraw Hill