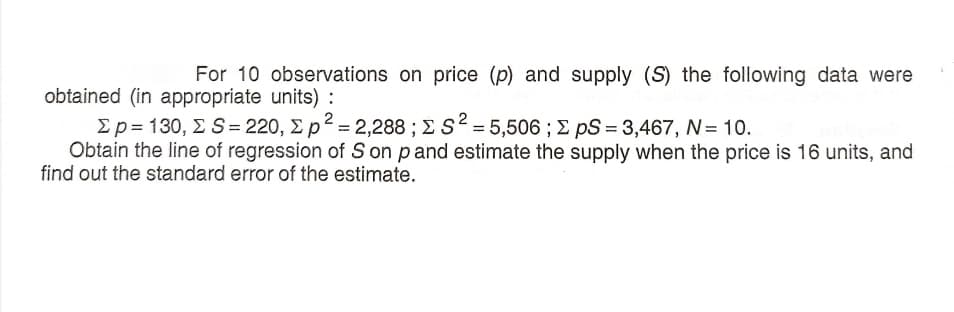
For 10 observations on price (p) and supply (S) the following data were obtained (in appropriate units) : Σp= 130, Σ S= 220, Σp* = 2,288 ; Σ S-5506 ; Σ pS = 3,467, N 10. Obtain the line of regression of S on pand estimate the supply when the price is 16 units, and find out the standard error of the estimate.


Q: d) What proportion of college graduates believe in the theory of evolution? Use three decimal places...
A: d) From the given information, the number of college graduates believe in the theory of evolution is...
Q: Studies of the size and range of wild animal populations often involve tagging observed individual a...
A: Answer:----- Date:----21/2/2022
Q: Amend the following table and locate the median from amended table. Also measure the magnitude of th...
A: Concentration of all the values around the central value of the given data is known as measures of c...
Q: A retail company has historically sold an average of 32 items per day. A local franchise is testing ...
A: Here is given that, n = 30 t-statistic is 13.69 Hypothesis is one tailed test.
Q: [Data Set: L06096] A random sample of n = 6 observations from a normal distribution resulted in the ...
A: Given data is8,2,3,7,11,6sample size(n)=11
Q: A volumetric calcium analysis on triplicate samples of the blood serum of a patient believed to be s...
A: Given: Blood serum, X 3.11 3.24 3.27
Q: How do you classify the distribution 15, 30, 18, 18, 27, 15, 15, 30, 18 based on its mode? Multimoda...
A:
Q: A particular fruit's weights are normally distributed, with a mean of 786 grams and a standard devia...
A: Given: Weight of fruits are normally distributed with μ=786 gramsσ=17 grams
Q: A radio shop sells, on an verage, 200 radios per day with a standard deviation of 50 radios After an...
A: The z test is used to determine the mean significance relationship between the sample and the popula...
Q: Compute the linear correlation coefficient. The linear correlation coefficient for the four pieces o...
A: The data set shows x and y values.
Q: Table 2: Significant Relationship between Management Capability and Productivity of Employees Produc...
A: From the given information, Null Hypothesis: H0: There is no significance relationship between the ...
Q: mployees Leadership Skills Productivity of Employees Beta t-value p-value Skills .624** 1.56 .000 Kn...
A: Estimated Regression model between Management Capability of Administration and Productivity of emplo...
Q: Give at least one example for each type of frequency distribution. Grouped frequency distribution ...
A: “Since you have posted a question with multiple sub-parts, we will solve first three subparts for yo...
Q: CASE: You want to determine the degree/strength of relationship between height and weight. Variable ...
A:
Q: CASE: You want to determine the degree/strength of relationship between height and weight. Variable ...
A: Given, r=-0.65 So there is a moderate negative relationship between the two variables height (X)and ...
Q: Mean and standard deviation of the following continuous series are 31 and 15.9 respectively. The dis...
A:
Q: 4. The Thematic Apperception Test (TAT) presents participants with ambiguous pictures and asks them ...
A: The following data of number given to the stories told by 20 normal childrens mothers and 20 Schizop...
Q: 1. The following data are Mathematics scores of students grouped according of high school they come ...
A: From the given information, the claim of the problem is that 'the students' scores in one group is s...
Q: Suppose Allan is going to build a playlist that contains 7 songs. In how many ways can Allan arrange...
A:
Q: Find the least value of r in a sample of 18 pairs of observations from a bivariate normal population...
A:
Q: Find the standard deviation and coefficient of variation from the following data: Marks No. of Stude...
A:
Q: Acceptedcharacters:numbers, decimal point markers (period or comma), sign indicators (-),spaces (e.g...
A: In order to obtain the probability within the specified random variable (i.e., the amount a selected...
Q: Ajax has established a new sandwich shop format for airports and train stations.Here, the sandwitche...
A:
Q: se the lett of the best answer. on separate sheet of paper. 1. The given table represents a probabil...
A:
Q: 2. An educator wants to determine whether early exposure school will affect IQ. He enlists the aid o...
A: The t test is used to determine the mean significance between the sample and population. It is used ...
Q: In how many ways can 7 male students be arranged in a row if Hanz and Fitch insist next to each othe...
A:
Q: In a private school students can choose only of French, Spanish or Music as their Elective. In a gro...
A: i. The contingency table is given as follows: Spanish French Music Total Males 2...
Q: If the figure for a particular balance appears unusual on this basis, what is the probability that i...
A:
Q: Permutations are concerned with the number of ways O of selecting n ordered elements from a populati...
A:
Q: Assume that a sample is used to estimate a population mean μμ. Find the 99.5% confidence interval fo...
A: Ans#- Given the sample size n = 1013, sample mean x = 60.2, sample standard deviation s = 12.9 ...
Q: Using the standard normal table, find the value for zo that makes each statement correct. Enter your...
A:
Q: Heights of men on a baseball team have a bell-shaped distribution with a mean of 180cm and a standa...
A:
Q: ON 2: Computing the Mean and Variance of a Discrete Probability Distribution VIDUAL ACTIVITY #1 umbe...
A: We have given that Probability mass function. I want to find mean and standard deviation Mean = μ...
Q: Class Interval Frequency Class Marks Class Boundarieelative Frequen CF 20-26 12 23 19.5-26.5 0.12 12...
A: Given : Class interval Frequency Class Mark Class Boundaries Relative frequency <CF >CF 2...
Q: Find the mean for the given sample data. Unless indicated otherwise, round your answer to one more d...
A:
Q: Refer to the given problem in answering numbers 14-15. The daily demand for copies of a magazine at ...
A: the daily demand for copies of a magazine at a variety store has the probability distribution as fol...
Q: The highway fuel economy of a 2016 Lexus RX 350 FWD 6-cylinder 3.5-L automatic 5-speed using premium...
A:
Q: Question 21: Sara applied for visa to visit four different countries and let X be the number of acce...
A:
Q: A. Direction: In cach of the following examples, identify the sampling method being used. 1. A sampl...
A:
Q: A popular uprising that started on January 25, 2011, in Egypt led to the 2011 Egyptian Revolution. P...
A: 1. From the given information, The population proportion is 70%=0.70 Among a random sample of 60 hig...
Q: Suppose you have a distribution with a mean equal to 10, median equal to 20, and mode equal to 30.
A:
Q: Two people A and B play a series of games, in which they bet on a particular share price increasing ...
A: Since you have posted a question with multiple sub-parts, we will solve first three sub-parts for yo...
Q: Define : (i) Dichotomy, (ii) Classes and class frequencies.
A:
Q: [ Select ] The probability of any event ranges from 0 to 100 inclusive. [Select ] An impossible even...
A:
Q: urping (also known as "belching" or "eructation") is one way the human body expels excess gas in you...
A: Since the number of burps for cola and root beer comes from the same participant the data is a paire...
Q: how to I solve a using single linear Regression in excel or any excel method? I am struggling to und...
A: Formula: Let X be the size and Y be the rent. Excel Procedure: Enter X and Y data in Excel Go to D...
Q: A doctor records height and weight for her patients. The correlation between height and weight is 0....
A: Given that, The slope and intercept values are,
Q: A recent survey found that 30% of IRSC students plan to go on a vacation after graduation. Suppose 5...
A: Solution: Let X be the number of students that plan to go on a vacation after graduation. The prob...
Q: Evaluate ,C, and P6• (If necessary, consult a list of formulas.) „C, = 0 P.
A: Formula for combination nCx=n!/(x!(n-x)!) Formula for permutation nPx=n!/(n-x)!
Q: The mean yield of wheat from a district A was 210 tbs. with S.D.= 10 lbs. per acre from a sample of ...
A:

Step by step
Solved in 3 steps with 3 images

- Olympic Pole Vault The graph in Figure 7 indicates that in recent years the winning Olympic men’s pole vault height has fallen below the value predicted by the regression line in Example 2. This might have occurred because when the pole vault was a new event there was much room for improvement in vaulters’ performances, whereas now even the best training can produce only incremental advances. Let’s see whether concentrating on more recent results gives a better predictor of future records. (a) Use the data in Table 2 (page 176) to complete the table of winning pole vault heights shown in the margin. (Note that we are using x=0 to correspond to the year 1972, where this restricted data set begins.) (b) Find the regression line for the data in part ‚(a). (c) Plot the data and the regression line on the same axes. Does the regression line seem to provide a good model for the data? (d) What does the regression line predict as the winning pole vault height for the 2012 Olympics? Compare this predicted value to the actual 2012 winning height of 5.97 m, as described on page 177. Has this new regression line provided a better prediction than the line in Example 2?One set of 20 pairs of scores, X and Y values, produces a correlation of r = 0.70. If SSY = 150, calculate the standard error of the estimate for the regression lineYou spilled water on your calculations from (a) and can't remember what your estimated regression parameters are. But you do have two possible estimated errors for each of your initial four observations:
- A set of n = 15 pairs of X and Y values has a correlation of r = +0.80 with SSY = 75, and the regression equation for predicting Y is computed. Find the standard error of estimate for the regression equation. How big would the standard error be if the sample size were n = 30.A set of n = 25 pairs of X and Y values has a correlation of r = -0.50 with SSX = 38 and SSY = 14. Find the standard error of estimate for the regression equation. What percentage of the variance in Y is accounted for by X?Consider the following set of ordered pairs. Assuming that the regression line is y= 2.205 + 0.645x and that the SSE = 7.7180, test to determine if the slope is not equal to zero using a= 0.10. I am having trouble, please help!
- Consider a linear regression model for the decrease in blood pressure (mmHg) over a four-week period with muy=2.8+0.8x and standard deviation chi=3.2. The explanatory variable x is the number of servings fruits and vegetables in a calorie-controlled diet. What is the subpopulation mean when x = 7 servings per day?For the 2011 season, suppose the average number of passing yards per attempt for a certain NFL team was 6.1. Use the estimated regression equation developed in part (c) to predict the percentage of games won by that NFL team. (Note: For the 2011 season, suppose this NFL team's record was 7 wins and 9 losses. Round your answer to the nearest integer.)Consider a linear regression model for the decrease in blood pressure (mmHg) over a four-week period with muy=2.8+0.8x and standard deviation chi=3.2. The explanatory variable x is the number of servings fruits and vegetables in a calorie-controlled diet. What is the slope of the population regression line?
- A trucking company considered a multiple regression model for relating the dependent variable of total daily travel time for one of its drivers (hours) to the predictors distance traveled (miles) and the number of deliveries of made. After taking a random sample, a multiple regression was performed and the output is given below. Interpret the slope of the deliveries variable. When deliveries increases by 0.805 units, time increases by 1 hour, holding all other variables constant. 2) We do not have enough information to say. 3) When deliveries increases by 1 unit, time decreases by 0.805 hours, holding all other variables constant. 4) When deliveries decreases by 1 unit, time increases by 0.805 hours, holding all other variables constant. 5) When deliveries increases by 1 unit, time increases by 0.805 hours, holding all other variables constant.The Linear regression is used to predict Y from X in a certain population. In this population, SSY is 50, the correlation between X and Y is .5, and N is 100. What will be the standard error of the estimate?the regression line for a given dataset is found to be y^=76−5.32x. There is a pair of values x=7 and y=42 in this dataset taken from a specific individual. Compute the residual (error) of the predicted value y^ for this individual. Give your answer to two decimal places.