For a certain survey, software reports the results shown below for responses on the number of times a week the subject reads a newspaper. Complete parts a through d. N 69 Std Dev 2.9 95.0% CI (3.704,5.096) Variable News Mean SE Mean 0.349 A. No, because 7 is well outside the 95% confidence interval given in the software results. OB. No, because 7 is within the 95% confidence interval given in the software results. OC. Yes, because 7 is within the 95% confidence interval given in the software results. O D. Yes, because 7 is well outside the 95% confidence interval given in the software results. b. Suppose that the sample size had been 240, with x = 4.4 and s= 2.9. Use technology to find a 95% confidence interval. Describe the effect of sample size on the margin of error. The 95% confidence interval is (4.0, 4.8). (Round to one decimal place as needed.) Compare the confidence interval found in the previous step to the one reported. What effect does sample size have on the margin of error? A. As sample size increases, the margin of error becomes smaller. OB. As sample size increases, the margin of error does not change. OC. As sample size increases, the margin of error becomes larger. c. Does it seem plausible that the population distribution of this variable is normal? Why? O A. Yes, because there will be a few students who do not read a newspaper, many students who occasionally read a newspaper, and The distribution is likely to be normal. few students who read at least one newspaper every day. O B. No, because there will be a few students who do not read a newspaper, many students who occasionally read a newspaper, and a few students who read at least one newspaper every day. The distribution is not likely to be normal. OC. No, because there will be many students who do not read a newspaper but some students who read at least one newspaper every day. The distribution is likely to be skewed right. OD. No, because there will be a few students who do not read a newspaper but many students who read at least one newspaper every day. The distribution is likely to be skewed left.
For a certain survey, software reports the results shown below for responses on the number of times a week the subject reads a newspaper. Complete parts a through d. N 69 Std Dev 2.9 95.0% CI (3.704,5.096) Variable News Mean SE Mean 0.349 A. No, because 7 is well outside the 95% confidence interval given in the software results. OB. No, because 7 is within the 95% confidence interval given in the software results. OC. Yes, because 7 is within the 95% confidence interval given in the software results. O D. Yes, because 7 is well outside the 95% confidence interval given in the software results. b. Suppose that the sample size had been 240, with x = 4.4 and s= 2.9. Use technology to find a 95% confidence interval. Describe the effect of sample size on the margin of error. The 95% confidence interval is (4.0, 4.8). (Round to one decimal place as needed.) Compare the confidence interval found in the previous step to the one reported. What effect does sample size have on the margin of error? A. As sample size increases, the margin of error becomes smaller. OB. As sample size increases, the margin of error does not change. OC. As sample size increases, the margin of error becomes larger. c. Does it seem plausible that the population distribution of this variable is normal? Why? O A. Yes, because there will be a few students who do not read a newspaper, many students who occasionally read a newspaper, and The distribution is likely to be normal. few students who read at least one newspaper every day. O B. No, because there will be a few students who do not read a newspaper, many students who occasionally read a newspaper, and a few students who read at least one newspaper every day. The distribution is not likely to be normal. OC. No, because there will be many students who do not read a newspaper but some students who read at least one newspaper every day. The distribution is likely to be skewed right. OD. No, because there will be a few students who do not read a newspaper but many students who read at least one newspaper every day. The distribution is likely to be skewed left.

Glencoe Algebra 1, Student Edition, 9780079039897, 0079039898, 2018
18th Edition
ISBN:9780079039897
Author:Carter
Publisher:Carter
Chapter10: Statistics
Section10.4: Distributions Of Data
Problem 19PFA

Related questions
Question
Question 3, 8.3.46
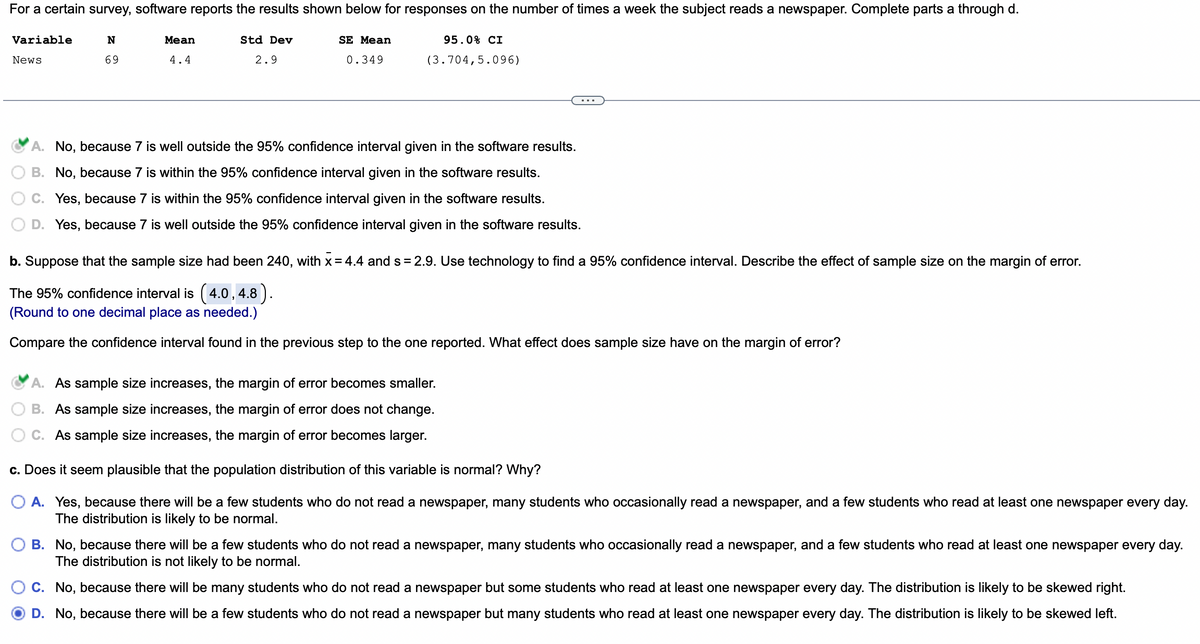
Transcribed Image Text:For a certain survey, software reports the results shown below for responses on the number of times a week the subject reads a newspaper. Complete parts a through d.
N
69
95.0% CI
(3.704,5.096)
Variable
News
Mean
4.4
Std Dev
2.9
SE Mean
0.349
A. No, because 7 is well outside the 95% confidence interval given in the software results.
B. No, because 7 is within the 95% confidence interval given in the software results.
C. Yes, because 7 is within the 95% confidence interval given in the software results.
D. Yes, because 7 is well outside the 95% confidence interval given in the software results.
b. Suppose that the sample size had been 240, with x = 4.4 and s= 2.9. Use technology to find a 95% confidence interval. Describe the effect of sample size on the margin of error.
The 95% confidence interval is (4.0, 4.8).
(Round to one decimal place as needed.)
Compare the confidence interval found in the previous step to the one reported. What effect does sample size have on the margin of error?
A. As sample size increases, the margin of error becomes smaller.
B. As sample size increases, the margin of error does not change.
C. As sample size increases, the margin of error becomes larger.
c. Does it seem plausible that the population distribution of this variable is normal? Why?
A. Yes, because there will be a few students who do not read a newspaper, many students who occasionally read a newspaper, and a few students who read at least one newspaper every day.
The distribution is likely to be normal.
B. No, because there will be a few students who do not read a newspaper, many students who occasionally read a newspaper, and a few students who read at least one newspaper every day.
The distribution is not likely to be normal.
C. No, because there will be many students who do not read a newspaper but some students who read at least one newspaper every day. The distribution is likely to be skewed right.
D. No, because there will be a few students who do not read a newspaper but many students who read at least one newspaper every day. The distribution is likely to be skewed left.
Expert Solution
This question has been solved!
Explore an expertly crafted, step-by-step solution for a thorough understanding of key concepts.

Step by step
Solved in 2 steps

Recommended textbooks for you
Glencoe Algebra 1, Student Edition, 9780079039897…
Algebra
ISBN:
9780079039897
Author:
Carter
Publisher:
McGraw Hill
Glencoe Algebra 1, Student Edition, 9780079039897…
Algebra
ISBN:
9780079039897
Author:
Carter
Publisher:
McGraw Hill