For a hypothesis test of a single population proportion, we can use the "Statistics" tab in the Probability Calculator in Geogebra or Basic Statistics > 1 Proportion" in Minitab. For Geogebra, click the drop-down menu near the top (default is "Z Test of a Mean") and choose "Z Test of a Proportion." Enter the of Successes (usually written as x, which is not the same thing as x), and sample size N. We'll use a sample of size 16 in which there successes. For Minitab, first select "Summarized Data" from the drop-down menu, then enter the number of events (Successes, x), and numer of (sample size N). Check "Perform Hypothesis Test" and enter the hypothesized proportion. Click Options and select your alternate hypothesis and "Normal Approximation" from the drop-down list. For a hypothesis test of Ho :p = 0.5 versus HA:p <0.5: • The given sample has a test statistic of -1.5012 • The P-value for the test is 0.053 For a hypothesis test of Ho :p = 0.3 versus HA : p > 0.3: • The given sample has a test statistic of 0.1068 • The P-value for the test is 0.457 For a hypothesis test of Ho :p = 0.3 versus HA:p + 0.3: • The given sample has a test statistic of 0.1068 • The P-value for the test is 0.914
For a hypothesis test of a single population proportion, we can use the "Statistics" tab in the Probability Calculator in Geogebra or Basic Statistics > 1 Proportion" in Minitab. For Geogebra, click the drop-down menu near the top (default is "Z Test of a Mean") and choose "Z Test of a Proportion." Enter the of Successes (usually written as x, which is not the same thing as x), and sample size N. We'll use a sample of size 16 in which there successes. For Minitab, first select "Summarized Data" from the drop-down menu, then enter the number of events (Successes, x), and numer of (sample size N). Check "Perform Hypothesis Test" and enter the hypothesized proportion. Click Options and select your alternate hypothesis and "Normal Approximation" from the drop-down list. For a hypothesis test of Ho :p = 0.5 versus HA:p <0.5: • The given sample has a test statistic of -1.5012 • The P-value for the test is 0.053 For a hypothesis test of Ho :p = 0.3 versus HA : p > 0.3: • The given sample has a test statistic of 0.1068 • The P-value for the test is 0.457 For a hypothesis test of Ho :p = 0.3 versus HA:p + 0.3: • The given sample has a test statistic of 0.1068 • The P-value for the test is 0.914

Chapter8: Sequences, Series,and Probability
Section8.7: Probability
Problem 11ECP: A manufacturer has determined that a machine averages one faulty unit for every 500 it produces....

Related questions
Question
Please see below. I need help with the answers in the red boxes. Those came back wrong.
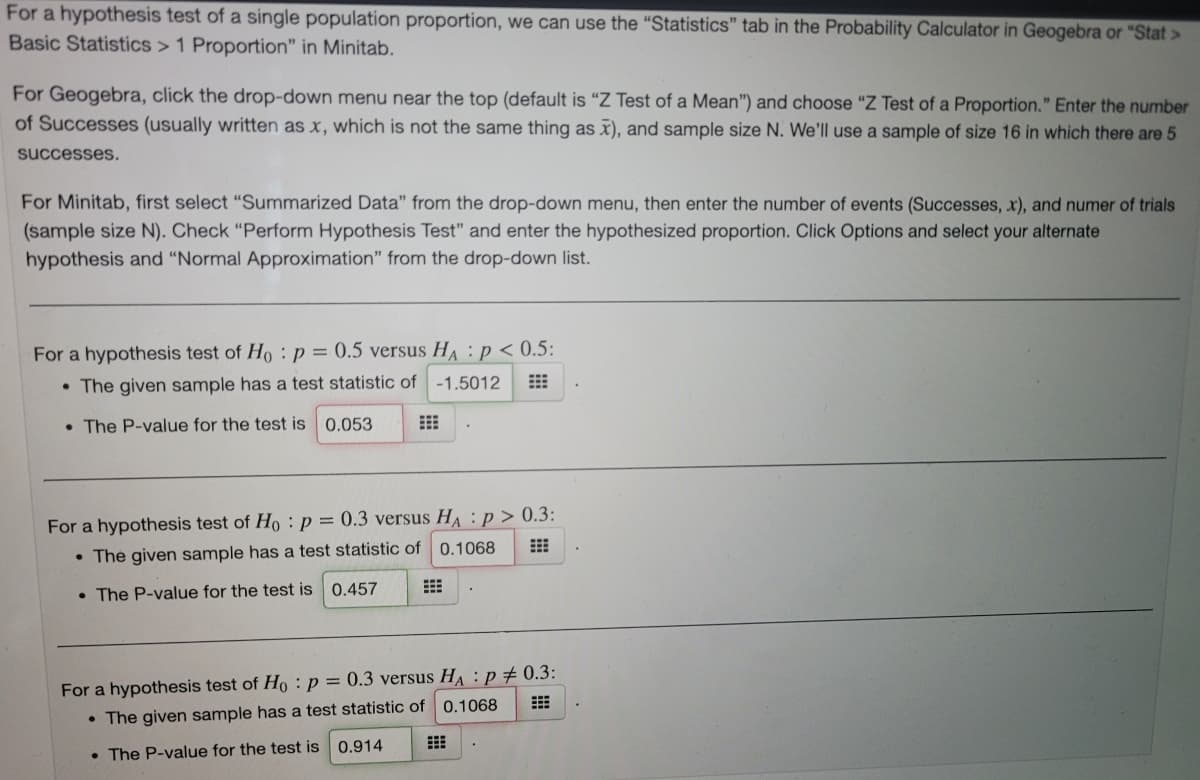
Transcribed Image Text:For a hypothesis test of a single population proportion, we can use the "Statistics" tab in the Probability Calculator in Geogebra or "Stat >
Basic Statistics > 1 Proportion" in Minitab.
For Geogebra, click the drop-down menu near the top (default is “Z Test of a Mean") and choose "Z Test of a Proportion." Enter the number
of Successes (usually written as x, which is not the same thing as x), and sample size N. We'll use a sample of size 16 in which there are 5
successes.
For Minitab, first select "Summarized Data" from the drop-down menu, then enter the number of events (Successes, x), and numer of trials
(sample size N). Check "Perform Hypothesis Test" and enter the hypothesized proportion. Click Options and select your alternate
hypothesis and "Normal Approximation" from the drop-down list.
For a hypothesis test of Ho :p = 0.5 versus HA : p < 0.5:
• The given sample has a test statistic of -1.5012
• The P-value for the test is 0.053
For a hypothesis test of Ho :p = 0.3 versus HA :p > 0.3:
• The given sample has a test statistic of 0.1068
• The P-value for the test is 0.457
For a hypothesis test of Ho :p = 0.3 versus HA : p # 0.3:
• The given sample has a test statistic of 0.1068
0.914
• The P-value for the test is
Expert Solution
This question has been solved!
Explore an expertly crafted, step-by-step solution for a thorough understanding of key concepts.

This is a popular solution!

Trending now
This is a popular solution!

Step by step
Solved in 4 steps with 3 images

Recommended textbooks for you
