for advertising its products. The following table shows amounts of radio time (X, in minutes) anu the number of electrical appliances sold (Y) over the last six weeks. 25 18 32 21 35 29 Y 16 11 20 15 26 28 Calculate the coefficient of correlation between the two series.
for advertising its products. The following table shows amounts of radio time (X, in minutes) anu the number of electrical appliances sold (Y) over the last six weeks. 25 18 32 21 35 29 Y 16 11 20 15 26 28 Calculate the coefficient of correlation between the two series.

Glencoe Algebra 1, Student Edition, 9780079039897, 0079039898, 2018
18th Edition
ISBN:9780079039897
Author:Carter
Publisher:Carter
Chapter10: Statistics
Section10.1: Measures Of Center
Problem 9PPS

Related questions
Question
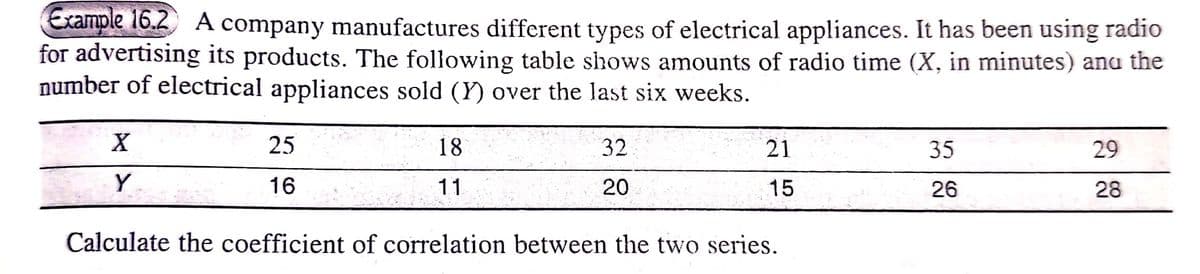
Transcribed Image Text:Example 16.2 A company manufactures different types of electrical appliances. It has been using radio
for advertising its products. The following table shows amounts of radio time (X, in minutes) ana the
number of electrical appliances sold (Y) over the last six weeks.
X.
25
18
32
21
35
29
Y
16
11
20
15
26
28
Calculate the coefficient of correlation between the two series.
Expert Solution
This question has been solved!
Explore an expertly crafted, step-by-step solution for a thorough understanding of key concepts.

Step by step
Solved in 2 steps with 1 images

Recommended textbooks for you
Glencoe Algebra 1, Student Edition, 9780079039897…
Algebra
ISBN:
9780079039897
Author:
Carter
Publisher:
McGraw Hill
Glencoe Algebra 1, Student Edition, 9780079039897…
Algebra
ISBN:
9780079039897
Author:
Carter
Publisher:
McGraw Hill