For each of the following scenarios, complete a thorough and complete test of significance. Be sure your write-ups include all of the following steps: 1. Define the parameter(s) of interest. 2. State in symbols and in words your null and alternative hypotheses. 3. Draw and label an appropriate diagram of the sampling distribution. 4. Check the technical conditions for this problem. Is your sampling distrubution valid? (For the sake of review, complete the problems regardless of whether or not the conditions hold!) 5. Determine the p-value for this application. 6. Explain what the p-value tells you about your sample result. Be sure to interpret this number as a probability. 7. State the results of your test keeping your comments within the context of the application. (This usually requires several sentences). 8. Have the calculator construct a confidence interval that backs up the result of your significance test. Show that the results of the significance test and the confidence interval are consistent with one another. Scenario A In 1994, an attempt was made to reestablish a healthy population of timber wolves on a large wildlife preserve in Alaska. Such attempts are considered to be successful if more than sixty percent of the animals introduced to the environment survive their first three-year period. Before releasing the animals, biologists tagged with radio transmitters a random sample of 40 wolves.
For each of the following scenarios, complete a thorough and complete test of significance. Be sure your write-ups include all of the following steps: 1. Define the parameter(s) of interest. 2. State in symbols and in words your null and alternative hypotheses. 3. Draw and label an appropriate diagram of the sampling distribution. 4. Check the technical conditions for this problem. Is your sampling distrubution valid? (For the sake of review, complete the problems regardless of whether or not the conditions hold!) 5. Determine the p-value for this application. 6. Explain what the p-value tells you about your sample result. Be sure to interpret this number as a probability. 7. State the results of your test keeping your comments within the context of the application. (This usually requires several sentences). 8. Have the calculator construct a confidence interval that backs up the result of your significance test. Show that the results of the significance test and the confidence interval are consistent with one another. Scenario A In 1994, an attempt was made to reestablish a healthy population of timber wolves on a large wildlife preserve in Alaska. Such attempts are considered to be successful if more than sixty percent of the animals introduced to the environment survive their first three-year period. Before releasing the animals, biologists tagged with radio transmitters a random sample of 40 wolves.

Holt Mcdougal Larson Pre-algebra: Student Edition 2012
1st Edition
ISBN:9780547587776
Author:HOLT MCDOUGAL
Publisher:HOLT MCDOUGAL
Chapter11: Data Analysis And Probability
Section: Chapter Questions
Problem 8CR

Related questions

Question
100%
Transcribed Image Text:23:13 2月8日周一
+令 @70%
A smschool.myschoolapp.com
G not a simp - Google
(79) 【Gmod 日常】逆风笑是我老大
M Student
smschool.myschoolapp.com/ftpi..
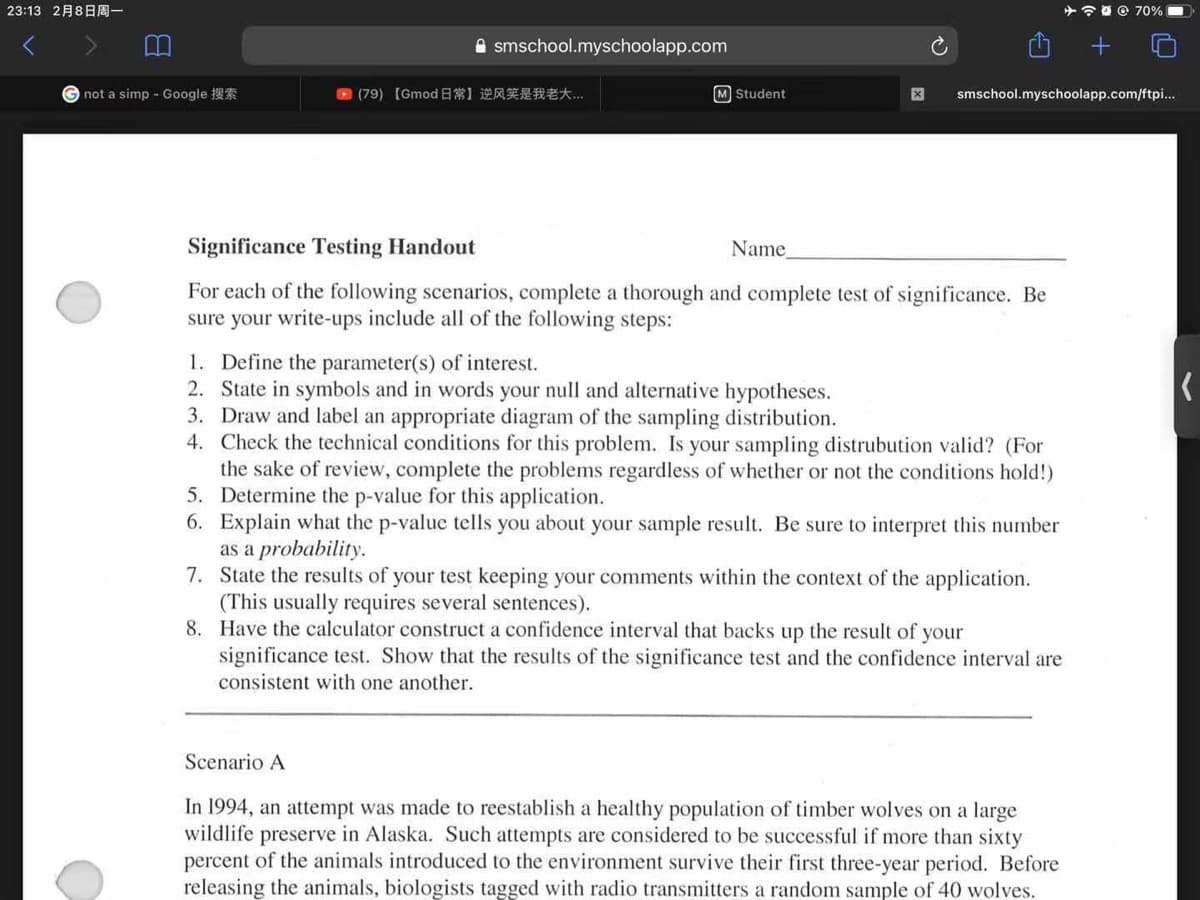
Significance Testing Handout
Name
For each of the following scenarios, complete a thorough and complete test of significance. Be
sure your write-ups include all of the following steps:
1. Define the parameter(s) of interest.
2. State in symbols and in words your null and alternative hypotheses.
3. Draw and label an appropriate diagram of the sampling distribution.
4. Check the technical conditions for this problem. Is your sampling distrubution valid? (For
the sake of review, complete the problems regardless of whether or not the conditions hold!)
5. Determine the p-value for this application.
6. Explain what the p-value tells you about your sample result. Be sure to interpret this number
as a probability.
7. State the results of your test keeping your comments within the context of the application.
(This usually requires several sentences).
8. Have the calculator construct a confidence interval that backs up the result of your
significance test. Show that the results of the significance test and the confidence interval are
consistent with one another.
Scenario A
In 1994, an attempt was made to reestablish a healthy population of timber wolves on a large
wildlife preserve in Alaska. Such attempts are considered to be successful if more than sixty
percent of the animals introduced to the environment survive their first three-year period. Before
releasing the animals, biologists tagged with radio transmitters a random sample of 40 wolves.
Expert Solution
This question has been solved!
Explore an expertly crafted, step-by-step solution for a thorough understanding of key concepts.

Step by step
Solved in 5 steps with 4 images

Knowledge Booster


Learn more about
Need a deep-dive on the concept behind this application? Look no further. Learn more about this topic, statistics and related others by exploring similar questions and additional content below.Recommended textbooks for you
Holt Mcdougal Larson Pre-algebra: Student Edition…
Algebra
ISBN:
9780547587776
Author:
HOLT MCDOUGAL
Publisher:
HOLT MCDOUGAL
Holt Mcdougal Larson Pre-algebra: Student Edition…
Algebra
ISBN:
9780547587776
Author:
HOLT MCDOUGAL
Publisher:
HOLT MCDOUGAL