For each specified discontinuity, sketch the graph of a possible function f(x) that illustrates the discontinuity. Example: it has a jump discontinuity at x = -2, then the possible graph of f is 5 3 y = (2) 2 1 -4 -3 -2 -1
For each specified discontinuity, sketch the graph of a possible function f(x) that illustrates the discontinuity. Example: it has a jump discontinuity at x = -2, then the possible graph of f is 5 3 y = (2) 2 1 -4 -3 -2 -1

College Algebra
7th Edition
ISBN:9781305115545
Author:James Stewart, Lothar Redlin, Saleem Watson
Publisher:James Stewart, Lothar Redlin, Saleem Watson
Chapter3: Polynomial And Rational Functions
Section3.6: Rational Functions
Problem 2E

Related questions
Question
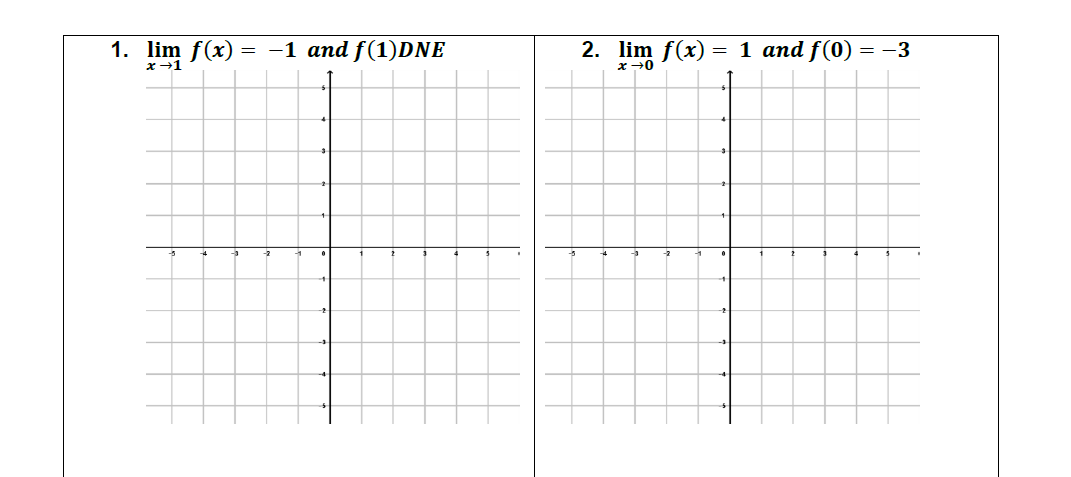
Transcribed Image Text:1. lim f(x)
-1 and f(1)DnE
2. lim f(x)
= 1 and f(0 = -3
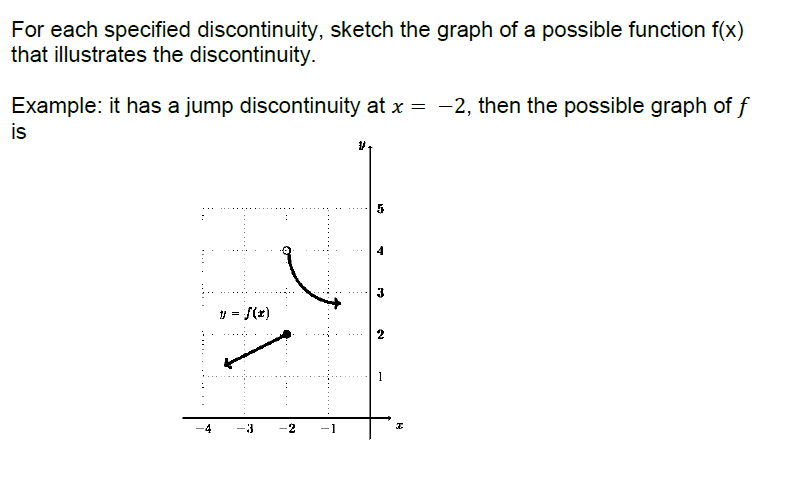
Transcribed Image Text:For each specified discontinuity, sketch the graph of a possible function f(x)
that illustrates the discontinuity.
Example: it has a jump discontinuity at x = -2, then the possible graph of f
is
5
3
y = (2)
2
1
-4
-3
-2
-1
Expert Solution
This question has been solved!
Explore an expertly crafted, step-by-step solution for a thorough understanding of key concepts.

This is a popular solution!

Trending now
This is a popular solution!

Step by step
Solved in 2 steps with 2 images

Recommended textbooks for you
College Algebra
Algebra
ISBN:
9781305115545
Author:
James Stewart, Lothar Redlin, Saleem Watson
Publisher:
Cengage Learning

Algebra & Trigonometry with Analytic Geometry
Algebra
ISBN:
9781133382119
Author:
Swokowski
Publisher:
Cengage
College Algebra
Algebra
ISBN:
9781305115545
Author:
James Stewart, Lothar Redlin, Saleem Watson
Publisher:
Cengage Learning
Algebra & Trigonometry with Analytic Geometry
Algebra
ISBN:
9781133382119
Author:
Swokowski
Publisher:
Cengage