For each table: 1. Identify the independent and dependent variables. 2. Identify units for the rate of change (e.g. change in y over change in x) 3. Describe the trend (e.g, increase or decrease) 4. Determine whether it shows a linear trend, quadratic trend or exponential trend (e.g. using the first differences, second differences or decay or growth factor) a) Year Goose Population 1 234 5 6 1190 1250 1310 1380 1455 1530
For each table: 1. Identify the independent and dependent variables. 2. Identify units for the rate of change (e.g. change in y over change in x) 3. Describe the trend (e.g, increase or decrease) 4. Determine whether it shows a linear trend, quadratic trend or exponential trend (e.g. using the first differences, second differences or decay or growth factor) a) Year Goose Population 1 234 5 6 1190 1250 1310 1380 1455 1530

Chapter4: Linear Functions
Section4.3: Fitting Linear Models To Data
Problem 23SE: The US. import of wine (in hectoliters) for several years is given in Table 5. Determine whether the...

Related questions
Question
Solve the following
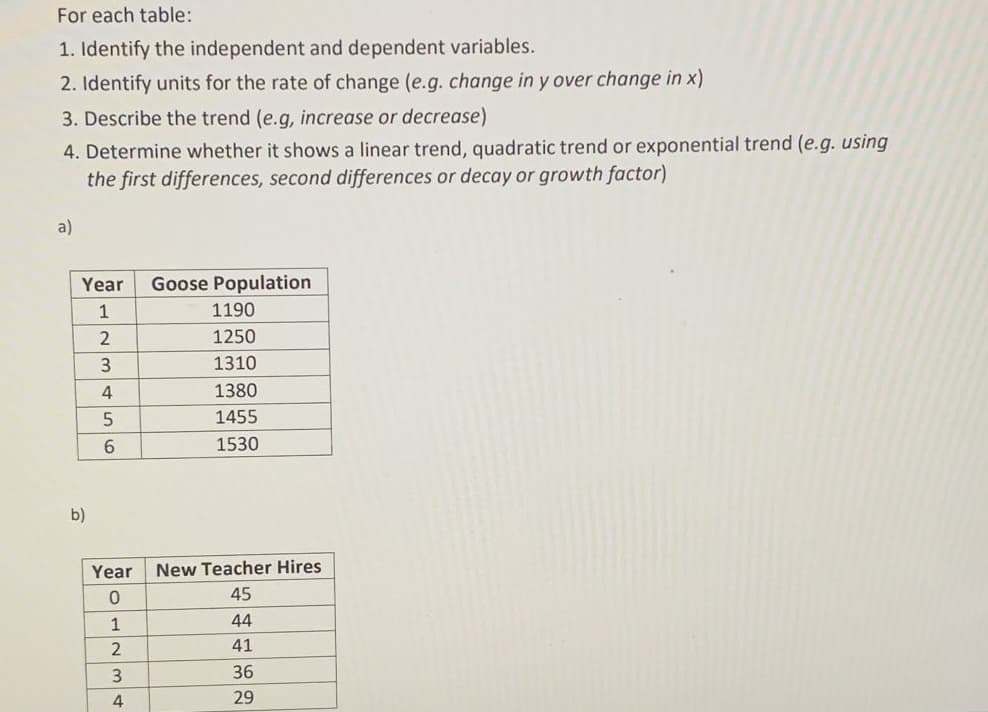
Transcribed Image Text:For each table:
1. Identify the independent and dependent variables.
2. Identify units for the rate of change (e.g. change in y over change in x)
3. Describe the trend (e.g, increase or decrease)
4. Determine whether it shows a linear trend, quadratic trend or exponential trend (e.g. using
the first differences, second differences or decay or growth factor)
a)
Year
1
2
3
4
5
6
b)
Year
0
1
2
3
4
Goose Population
1190
1250
1310
1380
1455
1530
New Teacher Hires
45
44
41
36
29
Expert Solution
This question has been solved!
Explore an expertly crafted, step-by-step solution for a thorough understanding of key concepts.

Step by step
Solved in 2 steps

Recommended textbooks for you

Algebra & Trigonometry with Analytic Geometry
Algebra
ISBN:
9781133382119
Author:
Swokowski
Publisher:
Cengage

Algebra and Trigonometry (MindTap Course List)
Algebra
ISBN:
9781305071742
Author:
James Stewart, Lothar Redlin, Saleem Watson
Publisher:
Cengage Learning
Algebra & Trigonometry with Analytic Geometry
Algebra
ISBN:
9781133382119
Author:
Swokowski
Publisher:
Cengage
Algebra and Trigonometry (MindTap Course List)
Algebra
ISBN:
9781305071742
Author:
James Stewart, Lothar Redlin, Saleem Watson
Publisher:
Cengage Learning

College Algebra
Algebra
ISBN:
9781305115545
Author:
James Stewart, Lothar Redlin, Saleem Watson
Publisher:
Cengage Learning