For each x-y table given, copy the table, find the pattern and fill in the missing entries. Then write the rule for the pattern in words. IN (x) OUT (y) a. b. IN (x) OUT (y) с. IN (x) OUT (y), 23 1 8 4 -2 -4 -2 -5 4 8. 26 -7.5 -20 -9 -10 302 27.5 1 1.5 -4 -10 -2.5 Rule: Rule: Rule: 3.
For each x-y table given, copy the table, find the pattern and fill in the missing entries. Then write the rule for the pattern in words. IN (x) OUT (y) a. b. IN (x) OUT (y) с. IN (x) OUT (y), 23 1 8 4 -2 -4 -2 -5 4 8. 26 -7.5 -20 -9 -10 302 27.5 1 1.5 -4 -10 -2.5 Rule: Rule: Rule: 3.

Algebra & Trigonometry with Analytic Geometry
13th Edition
ISBN:9781133382119
Author:Swokowski
Publisher:Swokowski
Chapter10: Sequences, Series, And Probability
Section10.8: Probability
Problem 64E

Related questions
Question
Can you please help me solve for the input and output? thanks
Transcribed Image Text:Review &
Preview
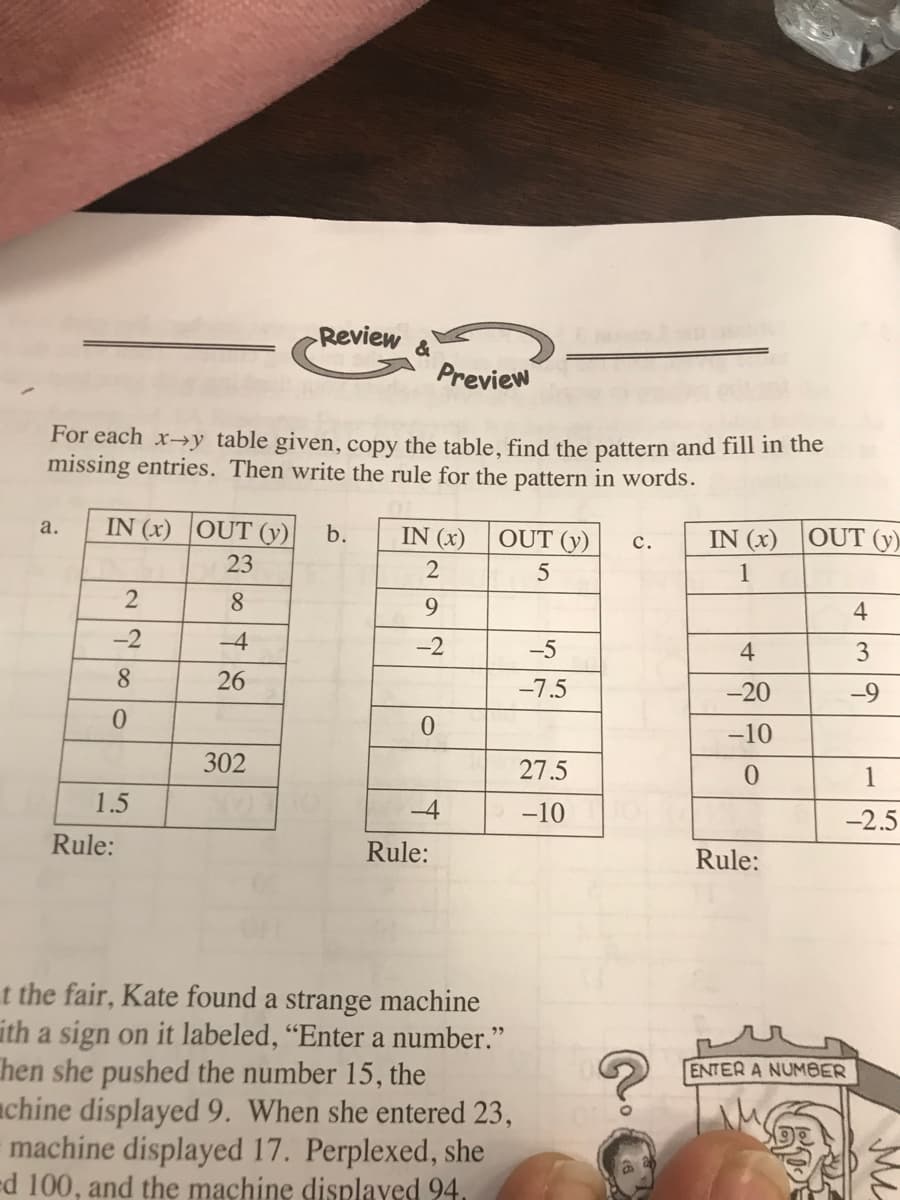
For each x→y table given, copy the table, find the pattern and fill in the
missing entries. Then write the rule for the pattern in words.
a.
IN (x) OUT (y)
b.
IN (x)
OUT (y)
IN (x)
OUT (y)
с.
23
1
2
8
9
4
-2
-4
-2
-5
4
3
8.
26
-7.5
-20
-9
-10
302
27.5
1
1.5
-4
-10
-2.5
Rule:
Rule:
Rule:
t the fair, Kate found a strange machine
ith a sign on it labeled, "Enter a number."
hen she pushed the number 15, the
achine displayed 9. When she entered 23,
machine displayed 17. Perplexed, she
rd 100, and the machine displayed 94.
ENTER A NUMBER
Expert Solution
This question has been solved!
Explore an expertly crafted, step-by-step solution for a thorough understanding of key concepts.

This is a popular solution!

Trending now
This is a popular solution!

Step by step
Solved in 4 steps with 4 images

Recommended textbooks for you
Algebra & Trigonometry with Analytic Geometry
Algebra
ISBN:
9781133382119
Author:
Swokowski
Publisher:
Cengage
Algebra & Trigonometry with Analytic Geometry
Algebra
ISBN:
9781133382119
Author:
Swokowski
Publisher:
Cengage