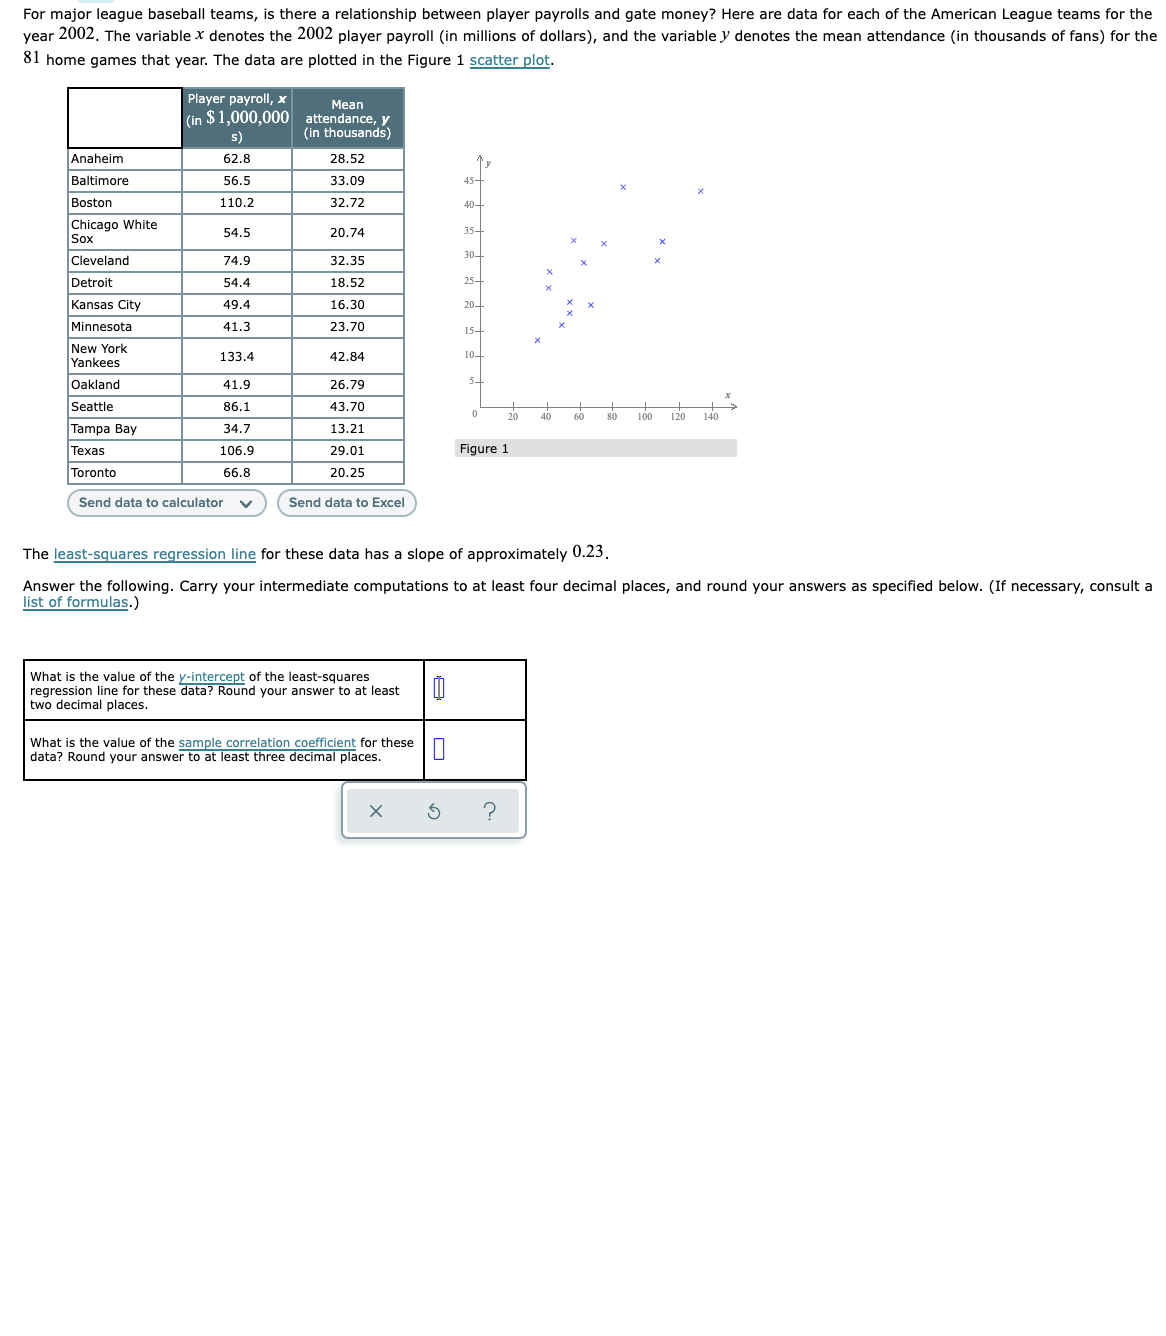
For major league baseball teams, is there a relationship between player payrolls and gate money? Here are data for each of the American League teams for the year 2002. The variable x denotes the 2002 player payroll (in millions of dollars), and the variable y denotes the mean attendance (in thousands of fans) for the 81 home games that year. The data are plotted in the Figure 1 scatter plot. Player payroll, x Mean (in $1,000,000 attendance, y (in thousands) s) Anaheim Baltimore 62.8 28.52 56.5 33.09 45+ Boston 110.2 32.72 40+ Chicago White Sox 54.5 20.74 35- 30- Cleveland 74.9 32.35 Detroit 54.4 18.52 25- Kansas City 49.4 16.30 20- Minnesota 41.3 23.70 15- New York Yankees 133.4 42.84 10- Oakland 41.9 26.79 Seattle 86.1 43.70 + 120 20 40 60 80 100 140 Tampa Bay 34.7 13.21 Texas 106.9 29.01 Figure 1 Toronto 66.8 20.25 Send data to calculator v Send data to Excel The least-squares regression line for these data has a slope of approximately 0.23. Answer the following. Carry your intermediate computations to at least four decimal places, and round your answers as specified below. (If necessary, consult a list of formulas.) What is the value of the y-intercept of the least-squares regression line for these data? Round your answer to at least two decimal places. What is the value of the sample correlation coefficient for these data? Round your answer to at least three decimal places.
For major league baseball teams, is there a relationship between player payrolls and gate money? Here are data for each of the American League teams for the year 2002. The variable x denotes the 2002 player payroll (in millions of dollars), and the variable y denotes the mean attendance (in thousands of fans) for the 81 home games that year. The data are plotted in the Figure 1 scatter plot. Player payroll, x Mean (in $1,000,000 attendance, y (in thousands) s) Anaheim Baltimore 62.8 28.52 56.5 33.09 45+ Boston 110.2 32.72 40+ Chicago White Sox 54.5 20.74 35- 30- Cleveland 74.9 32.35 Detroit 54.4 18.52 25- Kansas City 49.4 16.30 20- Minnesota 41.3 23.70 15- New York Yankees 133.4 42.84 10- Oakland 41.9 26.79 Seattle 86.1 43.70 + 120 20 40 60 80 100 140 Tampa Bay 34.7 13.21 Texas 106.9 29.01 Figure 1 Toronto 66.8 20.25 Send data to calculator v Send data to Excel The least-squares regression line for these data has a slope of approximately 0.23. Answer the following. Carry your intermediate computations to at least four decimal places, and round your answers as specified below. (If necessary, consult a list of formulas.) What is the value of the y-intercept of the least-squares regression line for these data? Round your answer to at least two decimal places. What is the value of the sample correlation coefficient for these data? Round your answer to at least three decimal places.

Big Ideas Math A Bridge To Success Algebra 1: Student Edition 2015
1st Edition
ISBN:9781680331141
Author:HOUGHTON MIFFLIN HARCOURT
Publisher:HOUGHTON MIFFLIN HARCOURT
Chapter9: Solving Quadratic Functions
Section: Chapter Questions
Problem 4CA

Related questions
Question
Transcribed Image Text:For major league baseball teams, is there a relationship between player payrolls and gate money? Here are data for each of the American League teams for the
year 2002. The variable x denotes the 2002 player payroll (in millions of dollars), and the variable y denotes the mean attendance (in thousands of fans) for the
81 home games that year. The data are plotted in the Figure 1 scatter plot.
Player payroll, x
Mean
$1,000,000 attendance, y
(in thousands)
(in
s)
Anaheim
62.8
28.52
Baltimore
56.5
33.09
45-
Boston
110.2
32.72
40-
Chicago White
Sox
54.5
20.74
35-
30-
Cleveland
74.9
32.35
Detroit
54.4
18.52
25-
Kansas City
49.4
16.30
20-
Minnesota
41.3
23.70
15-
New York
Yankees
133.4
42.84
10-
5-
Oakland
41.9
26.79
Seattle
86.1
43.70
20
40
60
80
100
120
140
Tampa Bay
34.7
13.21
Техas
106.9
29.01
Figure 1
Toronto
66.8
20.25
Send data to calculator
Send data to Excel
The least-squares regression line for these data has a slope of approximately 0.23.
Answer the following. Carry your intermediate computations to at least four decimal places, and round your answers as specified below. (If necessary, consult a
list of formulas.)
What is the value of the y-intercept of the least-squares
regression line for these data? Round your answer to at least
two decimal places.
What is the value of the sample correlation coefficient for these
data? Round your answer to at least three decimal places.
Expert Solution
This question has been solved!
Explore an expertly crafted, step-by-step solution for a thorough understanding of key concepts.

This is a popular solution!

Trending now
This is a popular solution!

Step by step
Solved in 2 steps with 1 images

Recommended textbooks for you
Big Ideas Math A Bridge To Success Algebra 1: Stu…
Algebra
ISBN:
9781680331141
Author:
HOUGHTON MIFFLIN HARCOURT
Publisher:
Houghton Mifflin Harcourt

Glencoe Algebra 1, Student Edition, 9780079039897…
Algebra
ISBN:
9780079039897
Author:
Carter
Publisher:
McGraw Hill

Holt Mcdougal Larson Pre-algebra: Student Edition…
Algebra
ISBN:
9780547587776
Author:
HOLT MCDOUGAL
Publisher:
HOLT MCDOUGAL
Big Ideas Math A Bridge To Success Algebra 1: Stu…
Algebra
ISBN:
9781680331141
Author:
HOUGHTON MIFFLIN HARCOURT
Publisher:
Houghton Mifflin Harcourt
Glencoe Algebra 1, Student Edition, 9780079039897…
Algebra
ISBN:
9780079039897
Author:
Carter
Publisher:
McGraw Hill
Holt Mcdougal Larson Pre-algebra: Student Edition…
Algebra
ISBN:
9780547587776
Author:
HOLT MCDOUGAL
Publisher:
HOLT MCDOUGAL

Functions and Change: A Modeling Approach to Coll…
Algebra
ISBN:
9781337111348
Author:
Bruce Crauder, Benny Evans, Alan Noell
Publisher:
Cengage Learning