For table 1, by stating the assumptions for using the One-way ANOVA, explain why it was used, and provide a conclusion through the use of its data. For table 2, explain what the Standard Deviation tells about the results, by explaining what 95% of confidence interval represents for the mean, and provide a conclusion through the use of its data. For table 3, by explaining the meaning "multiple comparison", provide a conclusion through the use of its data.
For table 1, by stating the assumptions for using the One-way ANOVA, explain why it was used, and provide a conclusion through the use of its data. For table 2, explain what the Standard Deviation tells about the results, by explaining what 95% of confidence interval represents for the mean, and provide a conclusion through the use of its data. For table 3, by explaining the meaning "multiple comparison", provide a conclusion through the use of its data.

Algebra & Trigonometry with Analytic Geometry
13th Edition
ISBN:9781133382119
Author:Swokowski
Publisher:Swokowski
Chapter7: Analytic Trigonometry
Section7.2: Trigonometric Equations
Problem 100E

Related questions
Question
100%
Please answer EVERY question VERY Clearly!
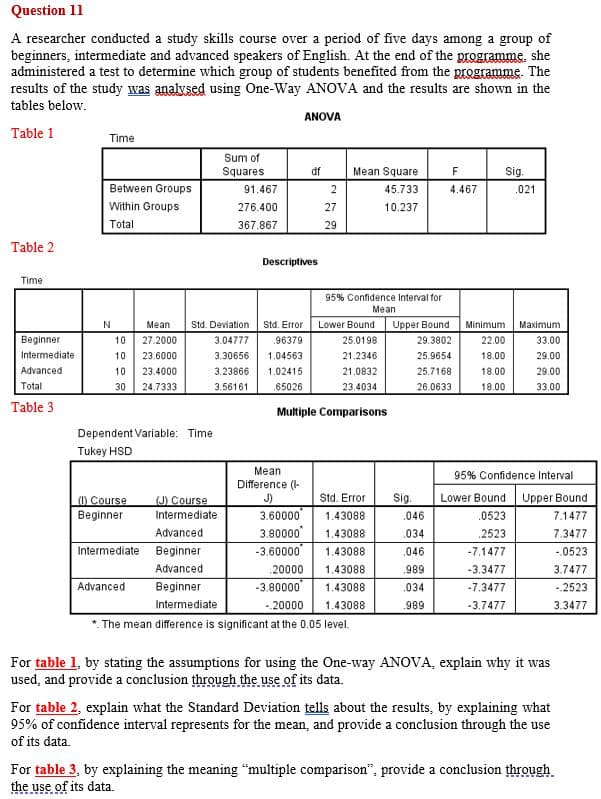
Transcribed Image Text:Question 11
A researcher conducted a study skills course over a period of five days among a group of
beginners, intermediate and advanced speakers of English. At the end of the programme, she
administered a test to determine which group of students benefited from the programme. The
results of the study was analvsed using One-Way ANOVA and the results are shown in the
tables below.
ANOVA
Table 1
Time
Sum of
Squares
df
Mean Square
F
Sig.
Between Groups
91.467
2
45.733
4.467
.021
Within Groups
276.400
27
10.237
Total
367.867
29
Table 2
Descriptives
Time
95% Confidence Interval for
Mean
Mean
Std. Deviation
Std. Error
Lower Bound
Upper Bound
Minimum
Maximum
Beginner
10
27.2000
3.04777
.96379
25.0198
29.3802
22.00
33.00
Intermediate
10
23.6000
3.30656
1.04563
21.2346
25.9654
18.00
29.00
Advanced
10
23.4000
3.23866
1.02415
21.0832
25.7168
18.00
29.00
Total
30
24.7333
3.56161
.65026
23.4034
26.0633
18.00
33.00
Table 3
Multiple Comparisons
Dependent Variable: Time
Tukey HSD
Mean
95% Confidence Interval
Difference (-
J)
Sig.
() Course
Beginner
(J) Course
Std. Error
Lower Bound
Upper Bound
3.60000
3.80000
-3.60000
Intermediate
1.43088
.046
.0523
7.1477
Advanced
1.43088
.034
2523
7.3477
Intermediate
Beginner
1.43088
.046
-7.1477
- 0523
Advanced
20000
1.43088
.989
-3.3477
3.7477
Advanced
Beginner
-3.80000
1.43088
.034
-7.3477
-.2523
Intermediate
-.20000
1.43088
.989
-3.7477
3.3477
The mean difference is significant at the 0.05 level.
For table 1, by stating the assumptions for using the One-way ANOVA, explain why it was
used, and provide a conclusion through the use of its data.
For table 2, explain what the Standard Deviation tells about the results, by explaining what
95% of confidence interval represents for the mean, and provide a conclusion through the use
of its data.
For table 3, by explaining the meaning “multiple comparison", provide a conclusion through
the use of its data.
Expert Solution
This question has been solved!
Explore an expertly crafted, step-by-step solution for a thorough understanding of key concepts.

Step by step
Solved in 3 steps

Knowledge Booster


Learn more about
Need a deep-dive on the concept behind this application? Look no further. Learn more about this topic, statistics and related others by exploring similar questions and additional content below.Recommended textbooks for you
Algebra & Trigonometry with Analytic Geometry
Algebra
ISBN:
9781133382119
Author:
Swokowski
Publisher:
Cengage
Algebra & Trigonometry with Analytic Geometry
Algebra
ISBN:
9781133382119
Author:
Swokowski
Publisher:
Cengage