For the accompanying data set, (a) draw scatter diagram of the data (b) by hand, compute the correlation coefficient, and (c) determine whether there is a linear relation between x and y Click here to view the data set. Click here to view the critical values table (a) Draw a scatter diagram of the data. Choose the correct graph below. OA. O B Oc. OD Ay 20- AY. 20 20 10 (b) By hand, compute the correlation coefficient The correlation coefficient isr= (Round to three decimal places as needed.) (c) Determine whether there is a linear relation between x and y Because the correlation coefficient is V and the absolute value of the correlation coefficient, v than the critical value for this data set, V linear relation exists between x and y (Round to three decimal places as needed.) 48°F P Type here to search
For the accompanying data set, (a) draw scatter diagram of the data (b) by hand, compute the correlation coefficient, and (c) determine whether there is a linear relation between x and y Click here to view the data set. Click here to view the critical values table (a) Draw a scatter diagram of the data. Choose the correct graph below. OA. O B Oc. OD Ay 20- AY. 20 20 10 (b) By hand, compute the correlation coefficient The correlation coefficient isr= (Round to three decimal places as needed.) (c) Determine whether there is a linear relation between x and y Because the correlation coefficient is V and the absolute value of the correlation coefficient, v than the critical value for this data set, V linear relation exists between x and y (Round to three decimal places as needed.) 48°F P Type here to search

Glencoe Algebra 1, Student Edition, 9780079039897, 0079039898, 2018
18th Edition
ISBN:9780079039897
Author:Carter
Publisher:Carter
Chapter4: Equations Of Linear Functions
Section4.5: Correlation And Causation
Problem 11PPS

Related questions
Question
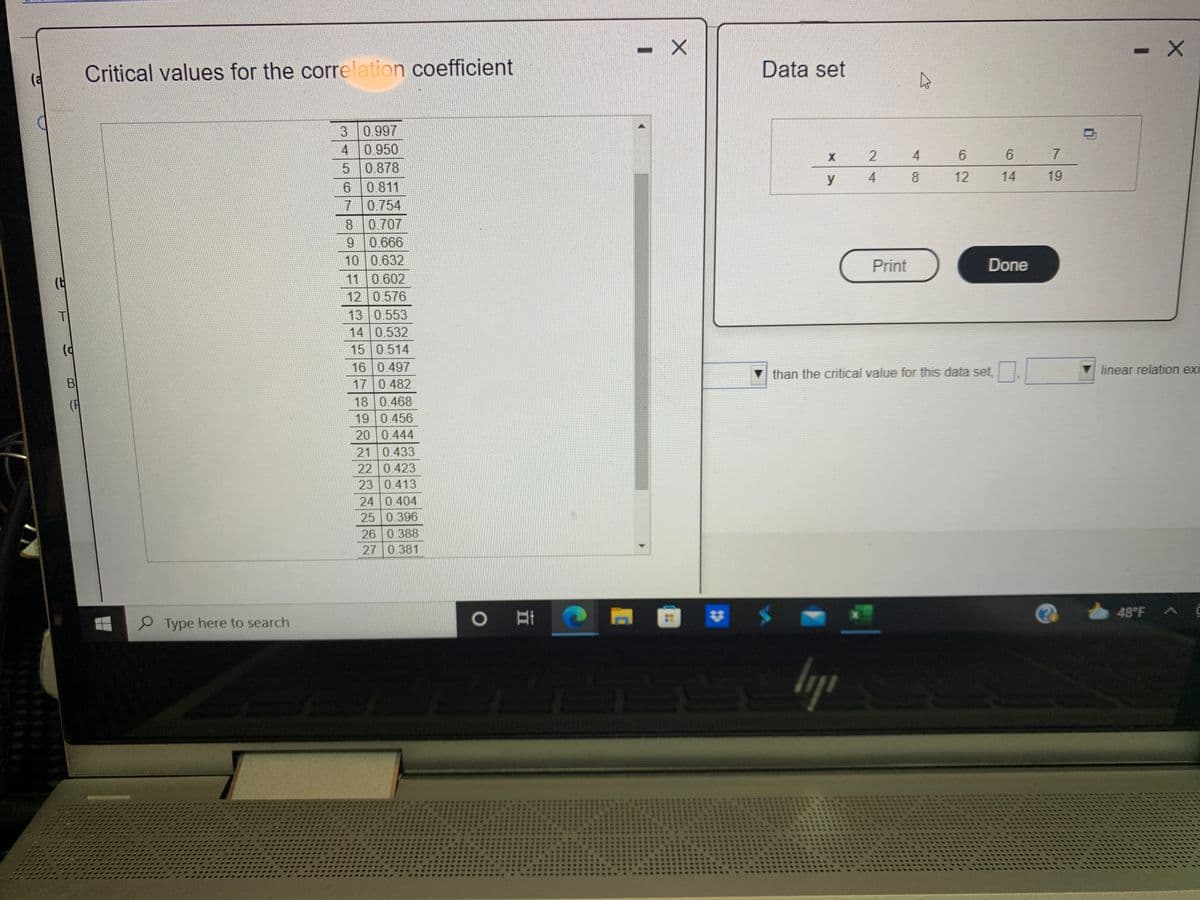
Transcribed Image Text:Critical values for the correlation coefficient
Data set
(a
3 0.997
4 0.950
5 0.878
6 0811
7 0.754
8 0.707
9 0.666
10 0.632
11 0 602
12 0.576
13 0.553
14 0.532
15 0.514
16 0.497
17 0.482
18 0.468
19 0.456
20 0.444
21 0.433
22 0.423
23 0.413
24 0.404
25 0.396
26 0.388
27 0.381
4
6.
7
y
8.
12
14
19
Print
Done
than the critical value for this data set.
linear relation exi
B
(F
48°F
Type here to search
0耳|
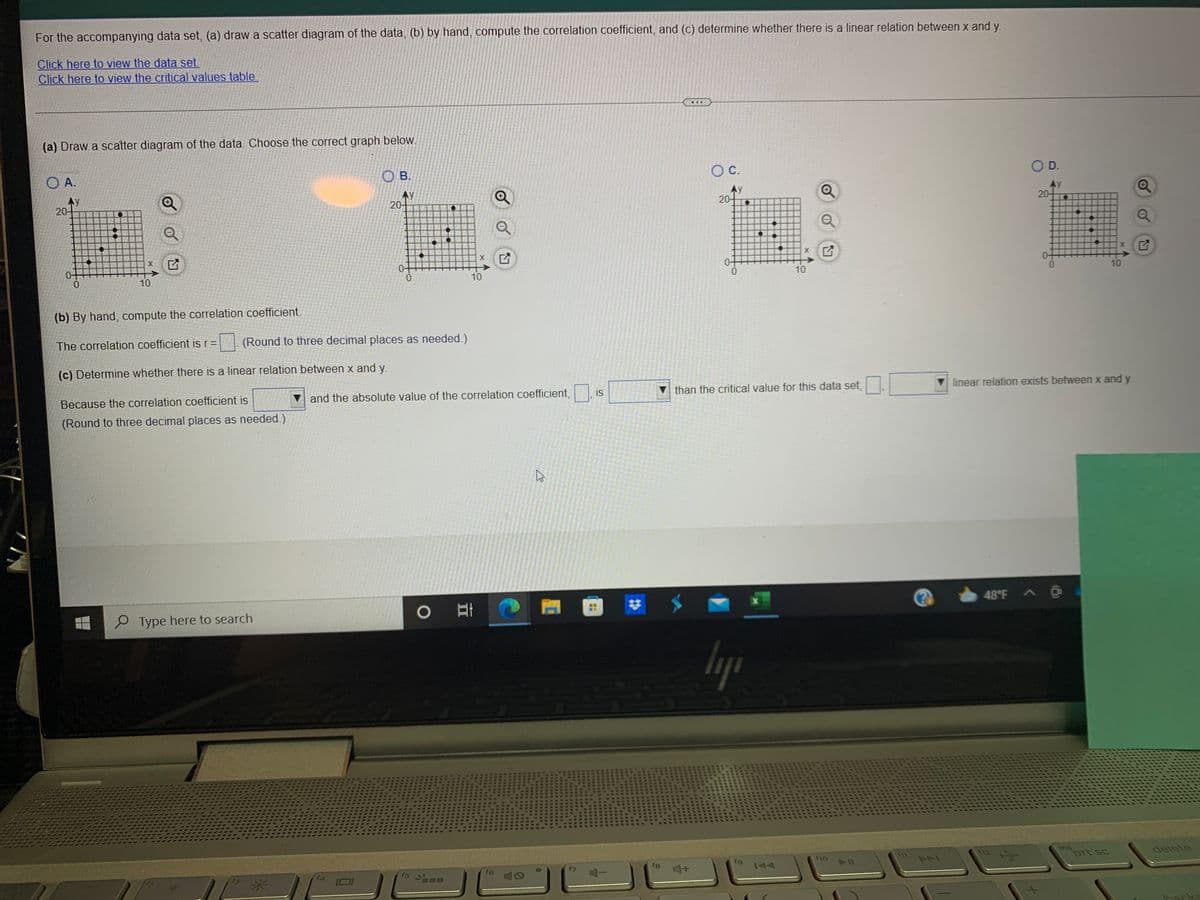
Transcribed Image Text:For the accompanying data set, (a) draw a scatter diagram of the data, (b) by hand, compute the correlation coefficient, and (c) determine whether there is a linear relation between x and y.
Click here to view the data set.
Click here to view the critical values table.
...
(a) Draw a scatter diagram of the data. Choose the correct graph below.
OC.
OD.
O B.
O A.
AY
20-
Ay
20-
Ay
20-
AY
20-
0+
10
10
0-
10
10
(b) By hand, compute the correlation coefficient.
The correlation coefficient is r=
(Round to three decimal places as needed.)
(c) Determine whether there is a linear relation between x and y.
linear relation exists between x and y.
is
than the critical value for this data set,
and the absolute value of the correlation coefficient,
Because the correlation coefficient is
(Round to three decimal places as needed.)
48°F A O
P Type here to search
lyp
ins
prt sc
delete
ho
f8
f6
米
IDI
Expert Solution
This question has been solved!
Explore an expertly crafted, step-by-step solution for a thorough understanding of key concepts.

This is a popular solution!

Trending now
This is a popular solution!

Step by step
Solved in 4 steps with 3 images

Recommended textbooks for you
Glencoe Algebra 1, Student Edition, 9780079039897…
Algebra
ISBN:
9780079039897
Author:
Carter
Publisher:
McGraw Hill
Glencoe Algebra 1, Student Edition, 9780079039897…
Algebra
ISBN:
9780079039897
Author:
Carter
Publisher:
McGraw Hill