For the data and sample regression equation shown below, complete parts (a) through (c). 0 3 5 5 9 1 3 y=1.130-0.120x 0-2 1 X y a. Determine the standard error of the estimate. b. Construct a residual plot. c. Construct a normal probability plot of the residuals. Click the icon to view the table of normal scores.
For the data and sample regression equation shown below, complete parts (a) through (c). 0 3 5 5 9 1 3 y=1.130-0.120x 0-2 1 X y a. Determine the standard error of the estimate. b. Construct a residual plot. c. Construct a normal probability plot of the residuals. Click the icon to view the table of normal scores.

Glencoe Algebra 1, Student Edition, 9780079039897, 0079039898, 2018
18th Edition
ISBN:9780079039897
Author:Carter
Publisher:Carter
Chapter4: Equations Of Linear Functions
Section4.6: Regression And Median-fit Lines
Problem 4PPS

Related questions
Question
Transcribed Image Text:K
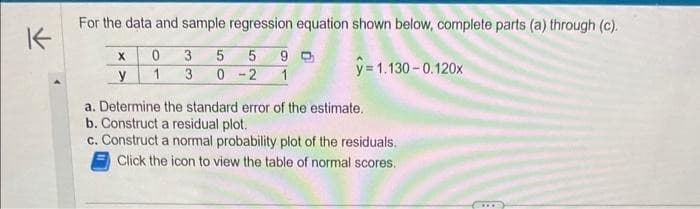
For the data and sample regression equation shown below, complete parts (a) through (c).
0
3
5 5 9
y=1.130 -0.120x
1 3
0-2 1
X
y
a. Determine the standard error of the estimate.
b. Construct a residual plot.
c. Construct a normal probability plot of the residuals.
Click the icon to view the table of normal scores.
...
Expert Solution
This question has been solved!
Explore an expertly crafted, step-by-step solution for a thorough understanding of key concepts.

This is a popular solution!

Trending now
This is a popular solution!

Step by step
Solved in 2 steps with 3 images

Recommended textbooks for you
Glencoe Algebra 1, Student Edition, 9780079039897…
Algebra
ISBN:
9780079039897
Author:
Carter
Publisher:
McGraw Hill
Glencoe Algebra 1, Student Edition, 9780079039897…
Algebra
ISBN:
9780079039897
Author:
Carter
Publisher:
McGraw Hill