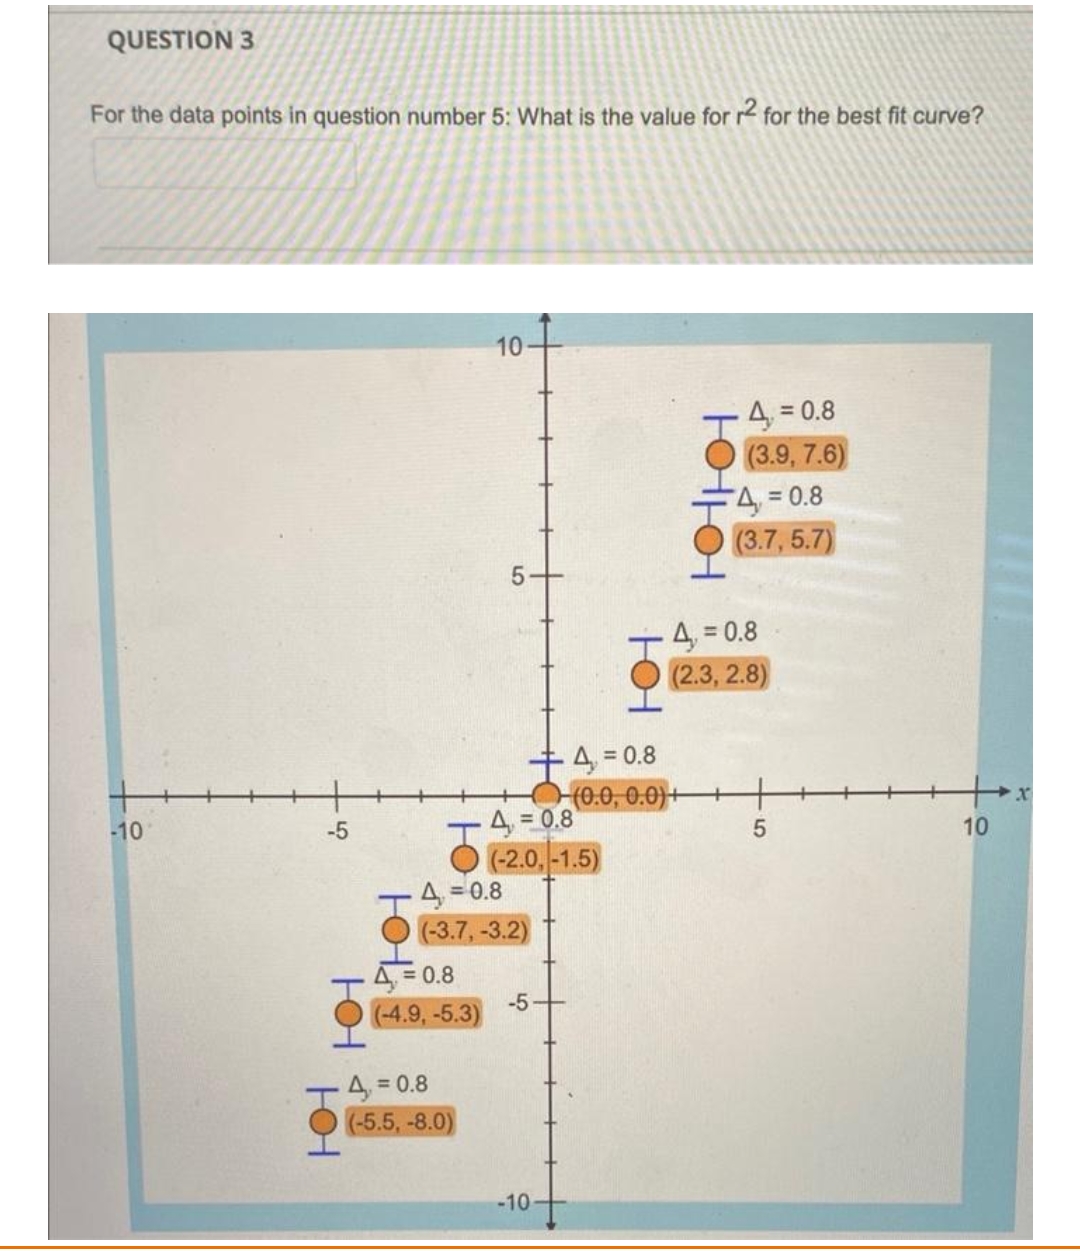
For the data points in question number 5: What is the value for r2 for the best fit curve?


Q: Data was collected for 300 fish from the North Atlantic. The length of the fish (in cm) is…
A: Solution- From given bar graph Class (length of fish in cm) frequency 220-222 222-224…
Q: IV. The table below shows the number of students who visit the library per day. X 30 45 52 55 60 16.…
A:
Q: 6. For the 2015 holiday season, a nation-wide survey estimated that parents spent an average of $422…
A: Given that, For the 2015 holiday season, a nation-wide survey estimated that parents spent an…
Q: 2. DETAILS ASWSBE14 9.E.057.MI. Need Help? Read It You may need to use the appropriate appendix…
A:
Q: K A standard deck of cards contains 52 cards. One card is selected from the deck. (a) Compute the…
A:
Q: If S = {0, 1, 2, 3, 4, 5, 6, 7, 8, 9}; and A = {1, 3, 5, 7, 9}; B = {0, 2, 4, 6, 8}; C = {4, 5, 6,…
A: “Since you have posted a question with multiple sub-parts, we will solve the first three sub-parts…
Q: In horse racing, a trifecta is a bet that the first three finishers in a race are selected, and they…
A: Since we know that when the ordering is important we will use the permutation and when ordering is…
Q: Solve all problems using a chi square analysis. You must use statistics to support your answers. 1.…
A: Given: Observed frequency Exhibit A with lower light intensity 36 Exhibit B with normal…
Q: The probability a machine has a lifespan of more than 5 years is 0.8. Ten machines are chosen at…
A:
Q: Suppose 23% of all people like a product so the population proportion p=0.23. Calculate the…
A:
Q: The probability that a component is acceptable is 0.93. Ten components are picked at random. What is…
A: Given thst, the probability that a component is acceptable is 0.93. Ten components are picked at…
Q: 4. The table shows the sales of Francine's gift shop for the last 8 months. Francine wants to…
A: Given: x y 1 35050 2 45250 3 37345 4 47652 5 64245 6 42524 7 31246 8 63246
Q: alculate (by hand) sample variance (SD2) and sample standard deviation (SD) of the distribution:…
A: The given data is 6, 8, 39, 36, 2, 36, 2, 20
Q: Use inductive reasoning to predict the next line in the sequence of computations. Then use a…
A: Given Sequence is: 333*333667=111111111 666*333667=222222222 999*333667=333333333…
Q: 6.7 Suppose that Z has a standard normal distribution. a Find the density function of U = Z². b Does…
A:
Q: Tom tossed a regular coin five times. He got HEAD, TAIL, HEAD, HEAD, and HEAD. If he continues to…
A: Given: Number of tosses = 5 n (new tosses) = 2 As it is a regular coin, P(heads) = P(tails) = 0.50
Q: levels since 1959. At that time, there were 319 parts per million of carbon dioxide in the…
A: Given: In 1959, the figure was 319 parts per million of carbon dioxide in the atmosphere. In 2005,…
Q: Write the estimated regression equation using the least squares estimates for b0b0 and b1b1
A: It is given that Intercept b0 = 477.24183007 And coefficient of month b1 = 26.73477812
Q: d. % of the countries have average Big Mac prices between $3.90 and $4.80. e. $3.90 is the prices,…
A: A box plot shows Max, min, first quartile, median, third quartile, median, outliers From the given…
Q: A fair die is thrown, find the amount of information gained if you are told that 4 will appear. a. O…
A: Given information: A fair die is thrown and we are told that 4 will appear.
Q: Suppose that scores on a particular test are normally distributed with a mean of 110 and a standard…
A: Given mean μ=110, standard deviation σ=15 Let X be the scores on a particular test are normally…
Q: Suppose a survey conducted in 2012 asked a group of adults from a certain country whether they drink…
A: Given: survey in 2021 asked group of adults from certain country whether they drink seltzer water…
Q: The probability that a component is acceptable is 0.93. Ten components are picked at random. What is…
A:
Q: Calculate E(X³), where X has the following PMF: .5 x=1 f(x)=.3 x=2 2 x=3
A: Given that PMF of X is x 1 2 3 f( x ) 0.5 0.3 0.2
Q: e a sample of 306 suspected crimina 85% confidence interval for the pop O Most Wanted list. Round…
A: We need to construct the 85% confidence interval for the population proportion. A confidence…
Q: Suppose X and Yare both independent and uniformly distributed on [0, 1] (i.e., f(x) = g(x) = 1 for x…
A: a) The probability density function (PDF) of X and Y is given as follows: fX(x)=gYx=1, 0≤x≤10,…
Q: Suppose that the elements of X = [X₁, X2, ..., Xn]' form a random sample from a Poisson (A)…
A: From cramer- rao lower bound we know that - Var(λ⏞(x)) ≥ {ψ'(θ)}2I(θ) ......(1) Where symbols have…
Q: In a relatively pointless survey, the following data was collected on cars in a Costco parking lot:…
A: Given information: Colour of cars Number of cars Purple 20 Light blue 78 Light gray 31…
Q: given by f(z) = e²,0 <=z <=10 Calculate the probability that z is less than 0.5
A: Given information:
Q: Find the equation of the line .that best fits, in the least squares sense, the data in the following…
A: The question is about fitting least square line Given : To find : Fit a line using least square…
Q: 7c
A: as you say i give only 7c answer
Q: 5. High school textbooks don't last forever. The lifespan of all high school textbooks is…
A: Given that: Mean, μ=9 years Population standard deviation, σ=2.5 years
Q: You are designing a road system leading to a city. There are 9 lights on the road and the…
A:
Q: Construct a Grouped Frequency Distribution table and graph the distribution. Make comments on the…
A:
Q: Consider the following data: {17, 14, 20, 18, 11} a) Find the sample mean of this data. b) Find the…
A: Given data is 17,14,20,18,11sample size(n)=5
Q: p.d.f. h(x) of the random variable x is defined by h(x) =3/(4(1-x²)),-1<x< 1,Calculate the expected…
A:
Q: The probability a machine has a lifespan of more than 5 years is 0.8. Ten machines are chosen at…
A:
Q: Suppose you measure many many heights and get the following histograms Histogram of Height X Top…
A:
Q: The probabilities of two events A and B are 0.23 and 0.30 respectively. The probability that both…
A:
Q: An experiment is investigating the effects of two drugs on the activity of rats. Drug A is a…
A: Given data: Drug A Drug B 8 14 9 12 11 11 14 11 10 12 9 12 12 11 6 14 10 9 11…
Q: Nos 9-11: Find the value of d. Given a random variable X has the following probability distribution:…
A: Concept:Sum of all probability in a distribution is always equal to 1
Q: The mean value is a single number which characterizes the set of numbers. It is useful in helping to…
A: The mean is the average value that is obtained by dividing the considered no. of observations from…
Q: Task: 1. Fill up the table for:
A: Note: Hi there! As per the guidelines, we are solving first three subparts for you. Kindly repost…
Q: Vivino website, suppose the mean price for a bottle of red wine that scores 4.0 or higher on the…
A: Given: Sample mean x¯=30.15 Sample standard deviation (s) = 12 Sample size (n) = 59 Hypothesized…
Q: A single card is drawn from a standard 52-card deck. What is the probability that the card is either…
A: given dat,A singal card is drawn from a standard 52 card deck,we have to find out the given…
Q: TABLE 1.3 Per capita total expenditure on health (international dollars) Dollars Country Dollars…
A: Introduction: We need to obtain the stemplot for the data.
Q: If S = {0, 1, 2, 3, 4, 5, 6, 7, 8, 9}, and A = {0, 2, 4, 6, 8}, B = {1, 3, 5, 7, 9}, C = {4, 5, 6,…
A: Solution: Given information: S={0,1,2,3,4,5,6,7,8,9} A={0,2,4,6,8} B={1,3,5,7,9} C={4,5,6,7} D=…
Q: Find the mean value of the function f(X,Y)= X² +Y².
A:
Q: Suppose that the sample of data that you are given is as follows: Observation Value 18 -5 23 16 4 45…
A: Given data:
Q: We are planning an experiment comparing three fertilizers. We will have six experimental units per…
A: The formula of the sample size is,


Trending now
This is a popular solution!

Step by step
Solved in 3 steps with 1 images

- Imagine that a professor of psychology has two teaching assistants (TAs) who will help her grade assignments for the duration of the semester. The professor wants to make sure that she and the TAs are well calibrated with one another, so she has all three of them grade the first assignment independently. Because the professor grades every assignment on a curve, she first converts the students’ scores to z-scores for each grader. The following table shows the z-scores for a population of 10 students in her class for each grader. Professor Teaching Assistant #1 Teaching Assistant #2 Student 1 0.70 1.27 1.27 Student 2 0.83 -0.64 -1.55 Student 3 -0.98 0.38 -0.14 Student 4 2.21 0.80 0.92 Student 5 -0.54 -1.34 -1.06 Student 6 0.43 0.10 0.30 Student 7 -1.03 -2.09 -1.50 Student 8 -0.01 0.85 1.14 Student 9 -0.54 0.48 0.57 Student 10 -1.07 0.20 0.04 The professor is going to use the z-scores to calculate the correlation coefficient between her scores…As the population ages, there is increasing concern about accident-related injuries to the elderly. An article reported on an experiment in which the maximum lean angle—the farthest a subject is able to lean and still recover in one step—was determined for both a sample of younger females (21–29 years) and a sample of older females (67–81 years). The following observations are consistent with summary data given in the article: YF: 28, 34, 32, 27, 28, 32, 31, 35, 32, 28 OF: 19, 14, 21, 13, 12 Does the data suggest that true average maximum lean angle for older females (OF) is more than 10 degrees smaller than it is for younger females (YF)? State and test the relevant hypotheses at significance level 0.10. (Use ?1 for younger females and ?2 for older females.) H0: ?1 − ?2 = 10Ha: ?1 − ?2 > 10H0: ?1 − ?2 = 10Ha: ?1 − ?2 < 10 H0: ?1 − ?2 = 0Ha: ?1 − ?2 > 0H0: ?1 − ?2 = 0Ha: ?1 − ?2 < 0 Calculate the test statistic and determine the P-value. (Round your test…As the population ages, there is increasing concern about accident-related injuries to the elderly. An article reported on an experiment in which the maximum lean angle—the farthest a subject is able to lean and still recover in one step—was determined for both a sample of younger females (21–29 years) and a sample of older females (67–81 years). The following observations are consistent with summary data given in the article: YF: 28, 34, 32, 27, 28, 32, 31, 35, 32, 28 OF: 19, 14, 21, 13, 12 Calculate the test statistic and determine the P-value. (Round your test statistic to one decimal place and your P-value to three decimal places.) t = P-value =
- A simple linear regression model was created to examine the relationship between the age of patients (i.e. the independent variable) and the patients' scores on a questionnaire that measures quality of life (i.e. the dependent variable). There were n=20 patients in the study, and some of the results of the regression are presented below: Estimated intercept = 42 Standard error of the intercept = 13.6 Estimated slope = -0.64 Standard error of the slope = 0.52 Based on these results, which of the following can we conclude, based on an alpha level of 0.05 for significance? Question 16 options: The intercept is not significantly different from 0, but the slope is significantly different than 0. Thus, we have mixed results and we cannot make a definitive statement about the significance of the association. There is a significant association, because the intercept is statistically significantly different than 0 (p<0.05). There is not a…magine that a professor of sociology has two teaching assistants (TAs) who will help him grade assignments for the duration of the semester. The professor wants to make sure that he and the TAs are well calibrated with one another, so he has all three of them grade the first assignment independently. Because the professor grades every assignment on a curve, he first converts the students’ scores to z-scores for each grader. The following table shows the z-scores for a population of 10 students in his class for each grader. Professor Teaching Assistant #1 Teaching Assistant #2 Student 1 1.43 1.05 0.39 Student 2 -0.57 -1.33 0.87 Student 3 0.35 0.27 -0.94 Student 4 0.72 0.90 2.24 Student 5 -1.41 -1.23 -0.50 Student 6 0.10 0.27 0.56 Student 7 -2.04 -1.71 -0.94 Student 8 0.76 1.19 0.03 Student 9 0.47 0.56 -0.50 Student 10 0.18 0.03 -1.21 The professor is going to use the z-scores to calculate the correlation coefficient between his scores and…A researcher was interested in estimating the relationship between SAT scores and first year GPA. He looked at the data from a university which requires minimum SAT scores of 600 to enter the university (Note. The possible SAT score is between 200-800). The data from this experiment are presented below. Student ID SAT(X) GPA (Y) 1 680 2.4 2 745 2.1 3 670 2.2 4 720 2.5 5 653 2.0 6 710 1.8 7 675 1.8 8 634 2.3 9 690 2.4 10 711 2.3 Mean 688.8 2.18 Variance 1109 0.06 = (X −X)(Y−Y) 3.15 Compute the Pearson correlation (r) and interpret the coefficient in terms of the direction (positive or negative) and strength of the relationship (weak, moderate, or strong) Many previous studies have found that there is a strong positive relationship between SAT score and the first year GPA. Is your conclusion from question (a)…
- A researcher was interested in estimating the relationship between SAT scores and first year GPA. He looked at the data from a university which requires minimum SAT scores of 600 to enter the university (Note. The possible SAT score is between 200-800). The data from this experiment are presented below. Student ID SAT(X) GPA (Y) 1 680 2.4 2 745 2.1 3 670 2.2 4 720 2.5 5 653 2.0 6 710 1.8 7 675 1.8 8 634 2.3 9 690 2.4 10 711 2.3 Mean 688.8 2.18 Variance 1109 0.06 = 3.15 Compute the Pearson correlation (r) and interpret the coefficient in terms of the direction (positive or negative) and strength of the relationship (weak, moderate, or strong)Given are five observations collected in a regression study on two variables. xi 2 6 9 13 20 yi 7 19 7 27 21 (a) Develop a scatter diagram for these data. A scatter diagram has 5 points plotted on it. The horizontal axis ranges from 0 to 25 and is labeled: x. The vertical axis ranges from 0 to 30 and is labeled: y. The points are plotted from left to right starting in the upper left corner of the diagram. Moving from left to right, the first 3 points appear to be plotted in an upward diagonal, direction while the next 2 points are much lower on the diagram. A scatter diagram has 5 points plotted on it. The horizontal axis ranges from 0 to 25 and is labeled: x. The vertical axis ranges from 0 to 30 and is labeled: y. The points are plotted from left to right in a downward, diagonal direction starting in the upper left corner of the diagram. The points are between 7 to 27 on the vertical axis and are fairly spread out. A scatter diagram has 5 points plotted on…Suppose a researcher wants to see if the proportion of college educated adults is higher in New York compared to Florida. The researcher randomly samples 500 adults in New York and found that 196 had a college education, while a random sample of 600 adults in Florida found that 227 had a college education.At the 0.05 level of significance, does the data provide evidence to suggest the proportion of college educated adults is higher in New York than Florida? Step 1: Define the parameter & setup the testStep 2: State the Level of SignificanceStep 3: Find the value of the Test StatisticsStep 4: Find P-Value OR Find Critical ValueStep 5: State Conclusion and why
- 3. For page 12 of chapter 9 notes, the steps for completing a linear correlation hypothesis test are provided. On step 5, a conclusion sentence must be written. Which option below best describes how make a conclusion sentence for a linear regression test?On the second sheet is data which shows the rate of growth of a particular patch of bamboo vs daily high temperature.(a) Construct a scatterplot, including the equation of the line of best fit and value of R2.(b) What would the predicted growth rate be for a day with a temperature of 84◦?(c) Is there evidence, at α = 0.01, to support a claim that there is a linear relationship between temperature and growth rate? Please state clearly the null hypothesis, the alternative hypothesis, and what decision you make.Sir Francis Galton, in the late 1800s, was the first to introduce the statistical concepts of regression and correlation. He studied the relations of variables such as the size of parents and the size of their offspring. Data similar to that which he studied are given below, with the variable x denoting the height (in centimeters) of a human father and the variable y denoting the height at maturity in centimeters) of the father's oldest son. The data are given in tabular form and also displayed in the Figure 1 scatter plot. Also given are the products of the heights of fathers and heights of sons for each of the fifteen pairs


