For the flow dataset (42-years of annual flow values) described earlier: (a) fit the normal distribution to this data set on a normal probability paper and show computations in a tabular form, (b) fit the log-normal distribution to this data set on a log-normal probability paper and show computations in a tabular form, (c) for both of the fitted distributions, compute the 90% confidence limits for the fitted probability curves and also show computations in a tabular form. In each case as listed above predict the 100-year, 150-year, and 200-year floods and compare results and how comparable are these results? please solve this question becuase i am struggling a lot
For the flow dataset (42-years of annual flow values) described earlier: (a) fit the normal distribution to this data set on a normal probability paper and show computations in a tabular form, (b) fit the log-normal distribution to this data set on a log-normal probability paper and show computations in a tabular form, (c) for both of the fitted distributions, compute the 90% confidence limits for the fitted probability curves and also show computations in a tabular form. In each case as listed above predict the 100-year, 150-year, and 200-year floods and compare results and how comparable are these results? please solve this question becuase i am struggling a lot

Algebra & Trigonometry with Analytic Geometry
13th Edition
ISBN:9781133382119
Author:Swokowski
Publisher:Swokowski
Chapter9: Systems Of Equations And Inequalities
Section9.1: Systems Of Equations
Problem 44E

Related questions
Question
For the flow dataset (42-years of annual flow values) described earlier:
(a) fit the
(b) fit the log-normal distribution to this data set on a log-normal probability paper and show computations in a tabular form,
(c) for both of the fitted distributions, compute the 90% confidence limits for the fitted probability curves and also show computations in a tabular form.
In each case as listed above predict the 100-year, 150-year, and 200-year floods and compare results and how comparable are these results?
please solve this question becuase i am struggling a lot
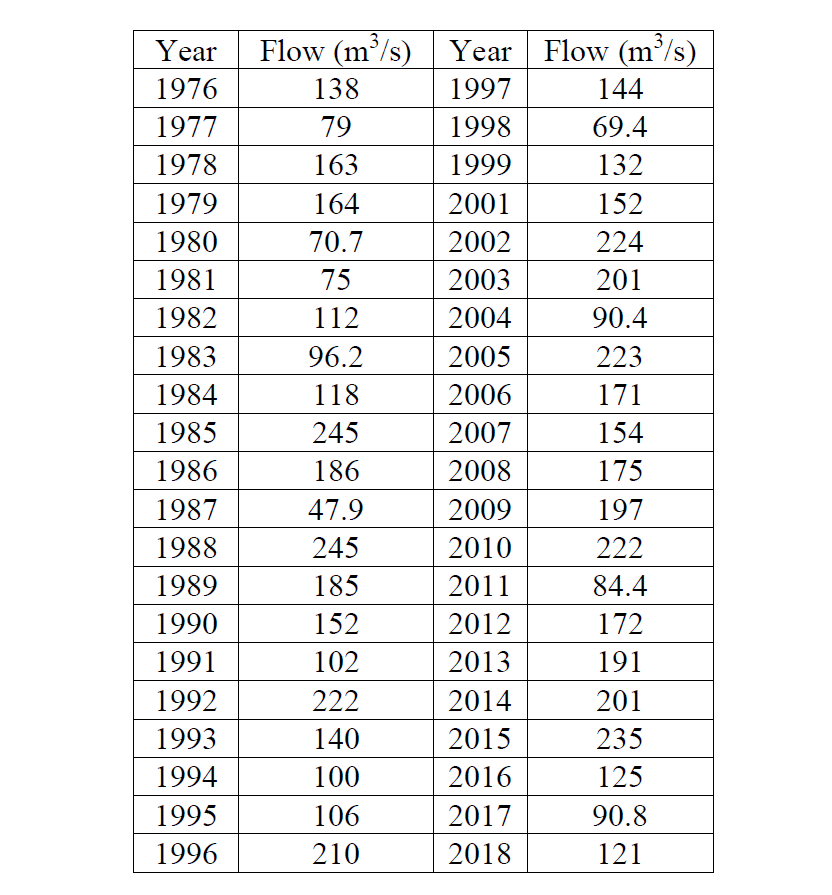
Transcribed Image Text:Year
Flow (m³/s)
Year Flow (m/s)
1976
138
1997
144
1977
79
1998
69.4
1978
163
1999
132
1979
164
2001
152
1980
70.7
2002
224
1981
75
2003
201
1982
112
2004
90.4
1983
96.2
2005
223
1984
118
2006
171
1985
245
2007
154
1986
186
2008
175
1987
47.9
2009
197
1988
245
2010
222
1989
185
2011
84.4
1990
152
2012
172
1991
102
2013
191
1992
222
2014
201
1993
140
2015
235
1994
100
2016
125
1995
106
2017
90.8
1996
210
2018
121
Expert Solution
This question has been solved!
Explore an expertly crafted, step-by-step solution for a thorough understanding of key concepts.

Step by step
Solved in 3 steps with 9 images

Recommended textbooks for you
Algebra & Trigonometry with Analytic Geometry
Algebra
ISBN:
9781133382119
Author:
Swokowski
Publisher:
Cengage

Algebra and Trigonometry (MindTap Course List)
Algebra
ISBN:
9781305071742
Author:
James Stewart, Lothar Redlin, Saleem Watson
Publisher:
Cengage Learning

Functions and Change: A Modeling Approach to Coll…
Algebra
ISBN:
9781337111348
Author:
Bruce Crauder, Benny Evans, Alan Noell
Publisher:
Cengage Learning
Algebra & Trigonometry with Analytic Geometry
Algebra
ISBN:
9781133382119
Author:
Swokowski
Publisher:
Cengage
Algebra and Trigonometry (MindTap Course List)
Algebra
ISBN:
9781305071742
Author:
James Stewart, Lothar Redlin, Saleem Watson
Publisher:
Cengage Learning
Functions and Change: A Modeling Approach to Coll…
Algebra
ISBN:
9781337111348
Author:
Bruce Crauder, Benny Evans, Alan Noell
Publisher:
Cengage Learning