For the following claim, find the null and alternative hypotheses, test statistic, critical value, and draw a conclusion. Assume that a simple random sample has been selected from a normally distributed population. Answer parts a-d. Claim: The mean IQ score of statistics professors is less than 116. Sample data: n= 17, x= 113, s = 6. The significance level is a =0.05. Click the icon to view a table of critical t-values.
For the following claim, find the null and alternative hypotheses, test statistic, critical value, and draw a conclusion. Assume that a simple random sample has been selected from a normally distributed population. Answer parts a-d. Claim: The mean IQ score of statistics professors is less than 116. Sample data: n= 17, x= 113, s = 6. The significance level is a =0.05. Click the icon to view a table of critical t-values.

Glencoe Algebra 1, Student Edition, 9780079039897, 0079039898, 2018
18th Edition
ISBN:9780079039897
Author:Carter
Publisher:Carter
Chapter10: Statistics
Section10.5: Comparing Sets Of Data
Problem 3BGP

Related questions
Topic Video
Question
Transcribed Image Text:Uestion Help
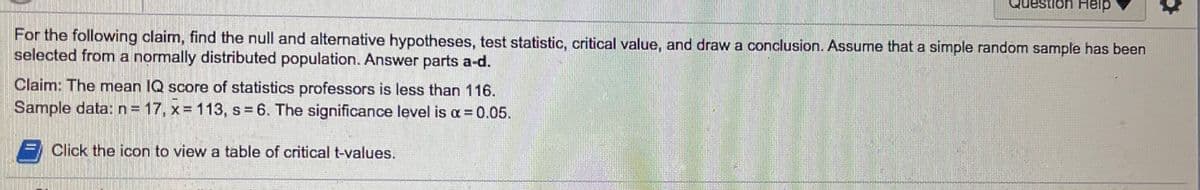
For the following claim, find the null and alternative hypotheses, test statistic, critical value, and draw a conclusion. Assume that a simple random sample has been
selected from a normally distributed population. Answer parts a-d.
Claim: The mean IQ score of statistics professors is less than 116.
Sample data: n= 17, x= 113, s 6. The significance level is a = 0.05,
/ Click the icon to view a table of critical t-values.
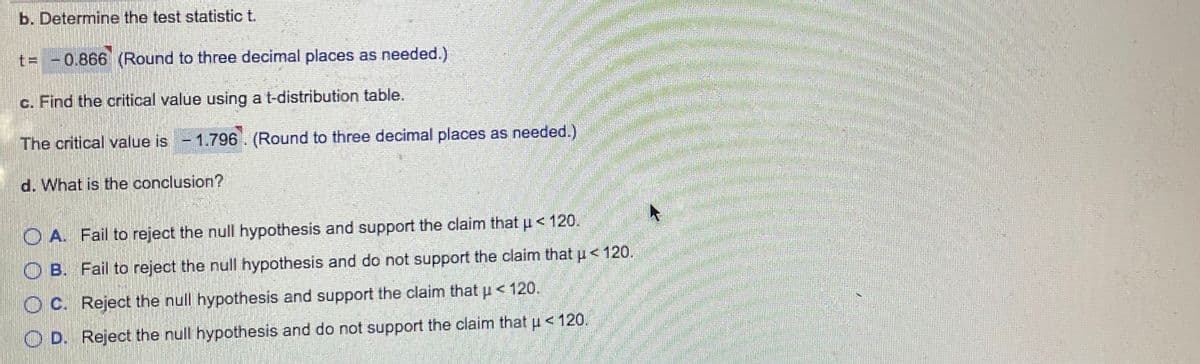
Transcribed Image Text:b. Determine the test statistic t.
t= -0.866 (Round to three decimal places as needed.)
c. Find the critical value using a t-distribution table.
The critical value is - 1.796. (Round to three decimal places as needed.)
d. What is the conclusion?
O A. Fail to reject the null hypothesis and support the claim that u < 120.
O B. Fail to reject the null hypothesis and do not support the claim that u< 120.
O C. Reject the null hypothesis and support the claim that p < 120.
O D. Reject the null hypothesis and do not support the claim that u < 120.
Expert Solution
This question has been solved!
Explore an expertly crafted, step-by-step solution for a thorough understanding of key concepts.

This is a popular solution!

Trending now
This is a popular solution!

Step by step
Solved in 3 steps with 1 images

Knowledge Booster


Learn more about
Need a deep-dive on the concept behind this application? Look no further. Learn more about this topic, statistics and related others by exploring similar questions and additional content below.Recommended textbooks for you
Glencoe Algebra 1, Student Edition, 9780079039897…
Algebra
ISBN:
9780079039897
Author:
Carter
Publisher:
McGraw Hill
Glencoe Algebra 1, Student Edition, 9780079039897…
Algebra
ISBN:
9780079039897
Author:
Carter
Publisher:
McGraw Hill