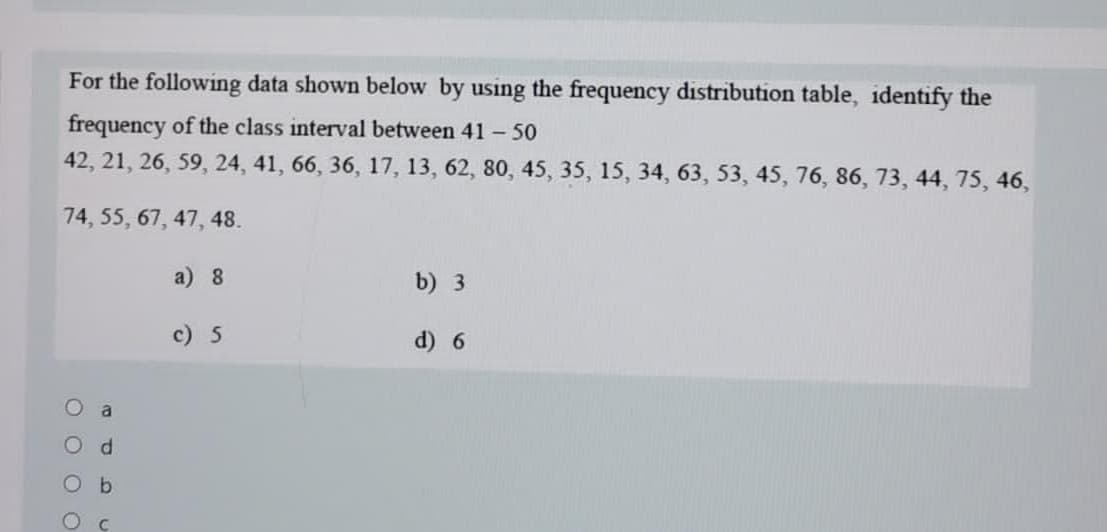
For the following data shown below by using the frequency distribution table, identify the frequency of the class interval between 41- 50 42, 21, 26, 59, 24, 41, 66, 36, 17, 13, 62, 80, 45, 35, 15, 34, 63, 53, 45, 76, 86, 73, 44, 75, 46, 74, 55, 67, 47, 48. a) 8 b) 3 c) 5 d) 6 a O O O O
For the following data shown below by using the frequency distribution table, identify the frequency of the class interval between 41- 50 42, 21, 26, 59, 24, 41, 66, 36, 17, 13, 62, 80, 45, 35, 15, 34, 63, 53, 45, 76, 86, 73, 44, 75, 46, 74, 55, 67, 47, 48. a) 8 b) 3 c) 5 d) 6 a O O O O
Glencoe Algebra 1, Student Edition, 9780079039897, 0079039898, 2018
18th Edition
ISBN:9780079039897
Author:Carter
Publisher:Carter
Chapter10: Statistics
Section10.4: Distributions Of Data
Problem 19PFA
Related questions
Question

Transcribed Image Text:For the following data shown below by using the frequency distribution table, identify the
frequency of the class interval between 41 - 50
42, 21, 26, 59, 24, 41, 66, 36, 17, 13, 62, 80, 45, 35, 15, 34, 63, 53, 45, 76, 86, 73, 44, 75, 46,
74, 55, 67, 47, 48.
a) 8
b) 3
c) 5
d) 6
a
O O O
Expert Solution
This question has been solved!
Explore an expertly crafted, step-by-step solution for a thorough understanding of key concepts.
Step by step
Solved in 2 steps with 2 images

Knowledge Booster
Learn more about
Need a deep-dive on the concept behind this application? Look no further. Learn more about this topic, advanced-math and related others by exploring similar questions and additional content below.Recommended textbooks for you

Glencoe Algebra 1, Student Edition, 9780079039897…
Algebra
ISBN:
9780079039897
Author:
Carter
Publisher:
McGraw Hill

Glencoe Algebra 1, Student Edition, 9780079039897…
Algebra
ISBN:
9780079039897
Author:
Carter
Publisher:
McGraw Hill