Convert the following distribution of scores into a grouped frequency table and (a) Determine the size of class intervals by dividing the range by 10. (b) Indicate the upper and lower limits of each class interval (c) Identify the midpoints of each class interval 47 56 42 28 56 41 56 55 82 78 57 38 62 52 66 65 72 37 47 42 54 48 52 47 44 39 53 48 42 54 48 56 42 60 50 68 62 55 62 68
Convert the following distribution of scores into a grouped frequency table and (a) Determine the size of class intervals by dividing the range by 10. (b) Indicate the upper and lower limits of each class interval (c) Identify the midpoints of each class interval 47 56 42 28 56 41 56 55 82 78 57 38 62 52 66 65 72 37 47 42 54 48 52 47 44 39 53 48 42 54 48 56 42 60 50 68 62 55 62 68

Glencoe Algebra 1, Student Edition, 9780079039897, 0079039898, 2018
18th Edition
ISBN:9780079039897
Author:Carter
Publisher:Carter
Chapter10: Statistics
Section10.4: Distributions Of Data
Problem 19PFA

Related questions
Question
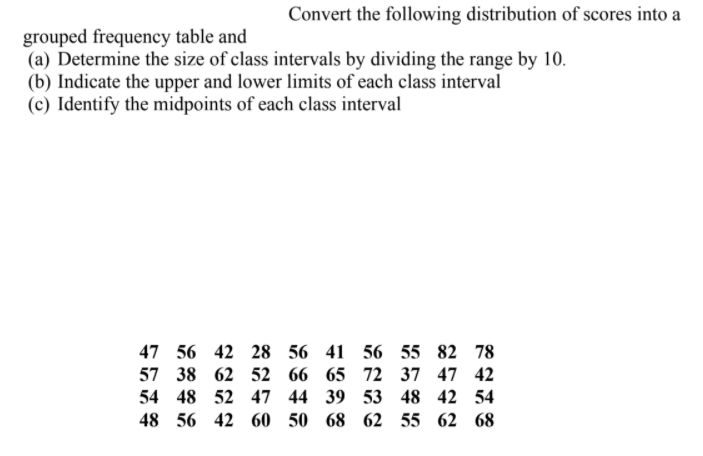
Transcribed Image Text:Convert the following distribution of scores into a
grouped frequency table and
(a) Determine the size of class intervals by dividing the range by 10.
(b) Indicate the upper and lower limits of each class interval
(c) Identify the midpoints of each class interval
47 56 42 28 56
41 56 55 82 78
57 38 62 52 66
65 72 37 47 42
54 48 52 47 44
39 53 48 42 54
48 56 42 60 50
68 62 55 62 68
Expert Solution
This question has been solved!
Explore an expertly crafted, step-by-step solution for a thorough understanding of key concepts.

Step by step
Solved in 2 steps with 1 images

Knowledge Booster


Learn more about
Need a deep-dive on the concept behind this application? Look no further. Learn more about this topic, statistics and related others by exploring similar questions and additional content below.Recommended textbooks for you
Glencoe Algebra 1, Student Edition, 9780079039897…
Algebra
ISBN:
9780079039897
Author:
Carter
Publisher:
McGraw Hill
Glencoe Algebra 1, Student Edition, 9780079039897…
Algebra
ISBN:
9780079039897
Author:
Carter
Publisher:
McGraw Hill