For the particular Year 2 that you chose, what is the maximum growth rate a country could have and still have a lower growth rate than 75% of the other countries in the world? Explain. Out of the years you chose, in which year did the smallest growth rate in GDP occur? What is the value and how did you determine it? Based on your summary statistics, did "Year 1" have higher GDP growth rates than the other two years? Give reasons for your answer. Make sure to not just compare max and min values, but rather use all the values of the 5-number summary and/or a boxplot. You might also argue based on the shape of the distribution and discuss the impact of outliers in your analysis. Which of the years you chose has the largest variability? Explain
For the particular Year 2 that you chose, what is the maximum growth rate a country could have and still have a lower growth rate than 75% of the other countries in the world? Explain. Out of the years you chose, in which year did the smallest growth rate in GDP occur? What is the value and how did you determine it? Based on your summary statistics, did "Year 1" have higher GDP growth rates than the other two years? Give reasons for your answer. Make sure to not just compare max and min values, but rather use all the values of the 5-number summary and/or a boxplot. You might also argue based on the shape of the distribution and discuss the impact of outliers in your analysis. Which of the years you chose has the largest variability? Explain

Big Ideas Math A Bridge To Success Algebra 1: Student Edition 2015
1st Edition
ISBN:9781680331141
Author:HOUGHTON MIFFLIN HARCOURT
Publisher:HOUGHTON MIFFLIN HARCOURT
Chapter2: Solving Linear Inequalities
Section2.5: Solving Compound Inequalities
Problem 40E

Related questions
Question
- For the particular Year 2 that you chose, what is the maximum growth rate a country could have and still have a lower growth rate than 75% of the other countries in the world? Explain.
- Out of the years you chose, in which year did the smallest growth rate in GDP occur? What is the value and how did you determine it?
- Based on your summary statistics, did "Year 1" have higher GDP growth rates than the other two years? Give reasons for your answer. Make sure to not just compare max and min values, but rather use all the values of the 5-number summary and/or a boxplot. You might also argue based on the shape of the distribution and discuss the impact of outliers in your analysis.
- Which of the years you chose has the largest variability? Explain
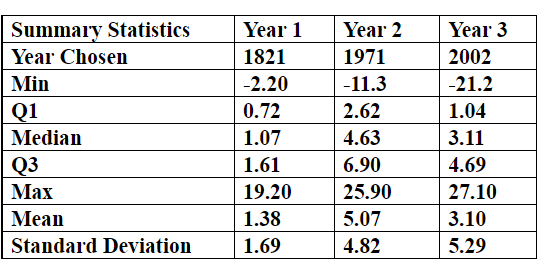
Transcribed Image Text:Summary Statistics
Year 1
Year 2
Year 3
Year Chosen
1821
1971
2002
Min
-2.20
-11.3
-21.2
Q1
0.72
2.62
1.04
Median
1.07
4.63
3.11
4.69
Q3
Мах
1.61
6.90
19.20
25.90
27.10
Меan
1.38
5.07
3.10
Standard Deviation
1.69
4.82
5.29
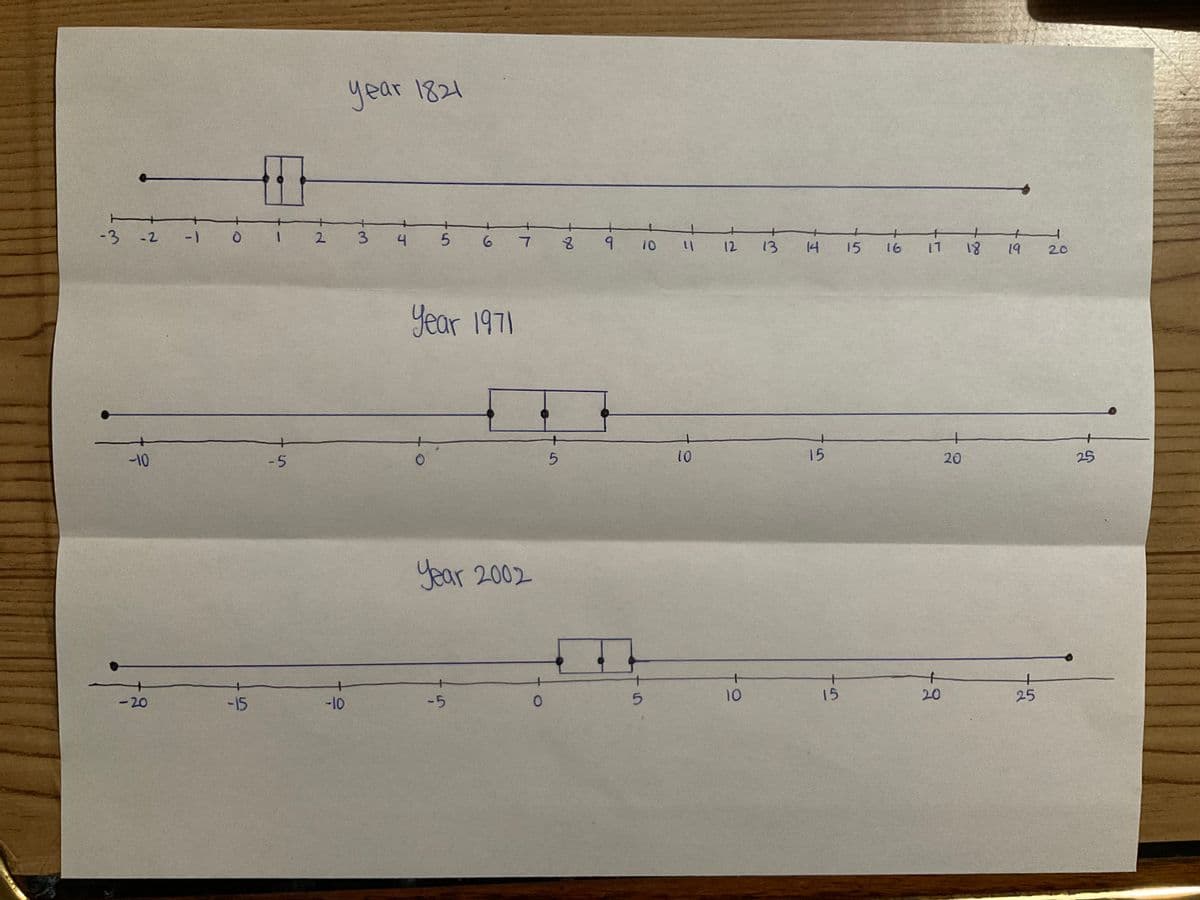
Transcribed Image Text:year 1821
-3 -2
-1
3 4
5 6 7
12 13
14
15
16
17
81
19
20
Year 1971
+
+
-10
-5
10
15
20
25
year 2002
-10
-5
5.
10
15
20
25
-20
-15
2.
Expert Solution
This question has been solved!
Explore an expertly crafted, step-by-step solution for a thorough understanding of key concepts.

This is a popular solution!

Trending now
This is a popular solution!

Step by step
Solved in 3 steps with 2 images

Recommended textbooks for you
Big Ideas Math A Bridge To Success Algebra 1: Stu…
Algebra
ISBN:
9781680331141
Author:
HOUGHTON MIFFLIN HARCOURT
Publisher:
Houghton Mifflin Harcourt

Glencoe Algebra 1, Student Edition, 9780079039897…
Algebra
ISBN:
9780079039897
Author:
Carter
Publisher:
McGraw Hill
Big Ideas Math A Bridge To Success Algebra 1: Stu…
Algebra
ISBN:
9781680331141
Author:
HOUGHTON MIFFLIN HARCOURT
Publisher:
Houghton Mifflin Harcourt
Glencoe Algebra 1, Student Edition, 9780079039897…
Algebra
ISBN:
9780079039897
Author:
Carter
Publisher:
McGraw Hill