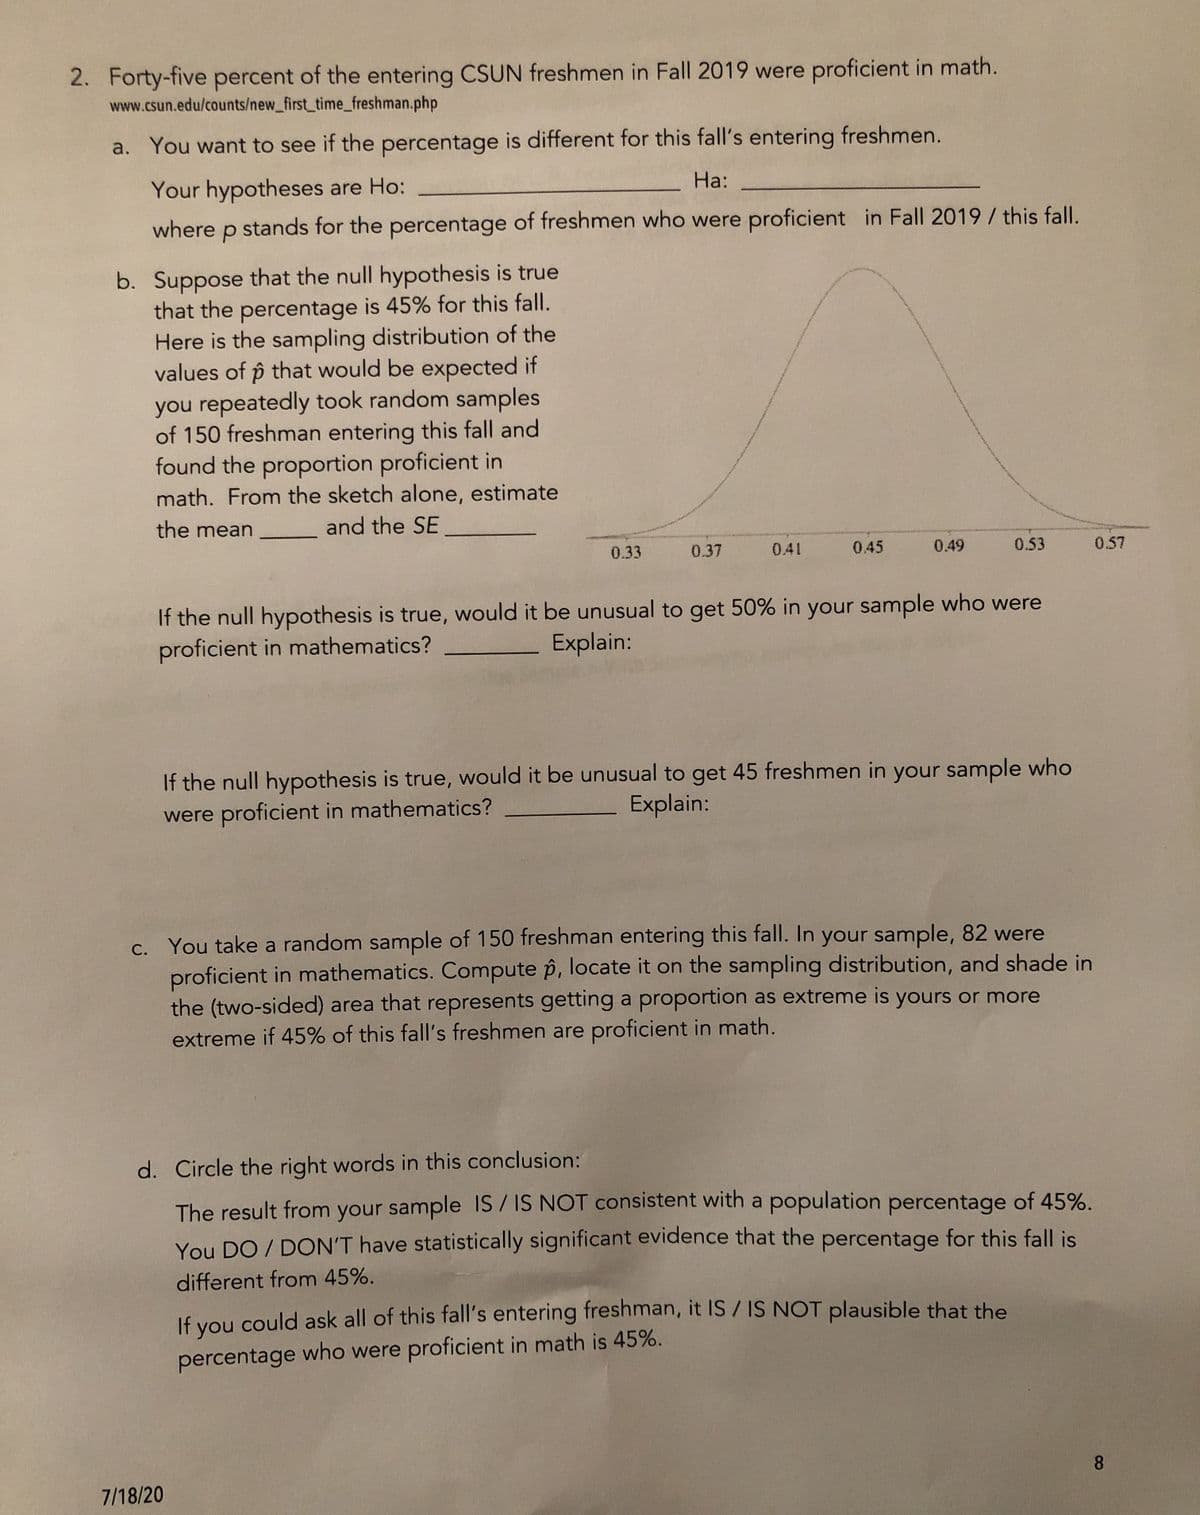
Forty-five percent of the entering CSUN freshmen in Fall 2019 were proficient in math. www.csun.edu/counts/new_first time_freshman.php a. You want to see if the percentage is different for this fall's entering freshmen. Ha: Your hypotheses are Ho: where stands for the percentage of freshmen who were proficient in Fall 2019/ this fall.


Compound Probability
Compound probability can be defined as the probability of the two events which are independent. It can be defined as the multiplication of the probability of two events that are not dependent.
Tree diagram
Probability theory is a branch of mathematics that deals with the subject of probability. Although there are many different concepts of probability, probability theory expresses the definition mathematically through a series of axioms. Usually, these axioms express probability in terms of a probability space, which assigns a measure with values ranging from 0 to 1 to a set of outcomes known as the sample space. An event is a subset of these outcomes that is described.
Conditional Probability
By definition, the term probability is expressed as a part of mathematics where the chance of an event that may either occur or not is evaluated and expressed in numerical terms. The range of the value within which probability can be expressed is between 0 and 1. The higher the chance of an event occurring, the closer is its value to be 1. If the probability of an event is 1, it means that the event will happen under all considered circumstances. Similarly, if the probability is exactly 0, then no matter the situation, the event will never occur.


Trending now
This is a popular solution!

Step by step
Solved in 3 steps with 4 images


