Fourteen jurors are randomly selected from a population of 3 million residents. Of these 3 million residents, it is known that 48% are of a minority race. Of the 14 jurors selected, 2 are minorities. (a) What proportion of the jury described is from a minority race? (b) If 14 jurors are randomly selected from a population where 48% are minorities, what is the probability that 2 or fewer jurors will be minorities? (c) What might the lawyer of a defendant from this minority race argue? (a) The proportion of the jury described that is from a minority race is 0.14. (Round to two decimal places as needed.) (b) The probability that 2 or fewer out of 14 jurors are minorities, assuming that the proportion of the population that are minorities is 48%, is (Round to four decimal places as needed.)
Fourteen jurors are randomly selected from a population of 3 million residents. Of these 3 million residents, it is known that 48% are of a minority race. Of the 14 jurors selected, 2 are minorities. (a) What proportion of the jury described is from a minority race? (b) If 14 jurors are randomly selected from a population where 48% are minorities, what is the probability that 2 or fewer jurors will be minorities? (c) What might the lawyer of a defendant from this minority race argue? (a) The proportion of the jury described that is from a minority race is 0.14. (Round to two decimal places as needed.) (b) The probability that 2 or fewer out of 14 jurors are minorities, assuming that the proportion of the population that are minorities is 48%, is (Round to four decimal places as needed.)

Holt Mcdougal Larson Pre-algebra: Student Edition 2012
1st Edition
ISBN:9780547587776
Author:HOLT MCDOUGAL
Publisher:HOLT MCDOUGAL
Chapter11: Data Analysis And Probability
Section11.8: Probabilities Of Disjoint And Overlapping Events
Problem 2C

Related questions

Concept explainers
Contingency Table
A contingency table can be defined as the visual representation of the relationship between two or more categorical variables that can be evaluated and registered. It is a categorical version of the scatterplot, which is used to investigate the linear relationship between two variables. A contingency table is indeed a type of frequency distribution table that displays two variables at the same time.
Binomial Distribution
Binomial is an algebraic expression of the sum or the difference of two terms. Before knowing about binomial distribution, we must know about the binomial theorem.
Topic Video
Question
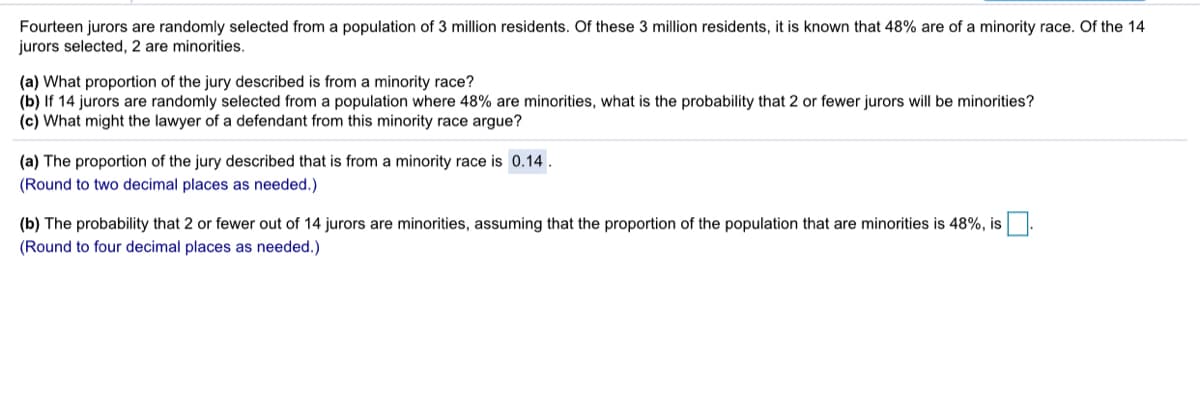
Transcribed Image Text:Fourteen jurors are randomly selected from a population of 3 million residents. Of these 3 million residents, it is known that 48% are of a minority race. Of the 14
jurors selected, 2 are minorities.
(a) What proportion of the jury described is from a minority race?
(b) If 14 jurors are randomly selected from a population where 48% are minorities, what is the probability that 2 or fewer jurors will be minorities?
(c) What might the lawyer of a defendant from this minority race argue?
(a) The proportion of the jury described that is from a minority race is 0.14.
(Round to two decimal places as needed.)
(b) The probability that 2 or fewer out of 14 jurors are minorities, assuming that the proportion of the population that are minorities is 48%, is
(Round to four decimal places as needed.)
Expert Solution
This question has been solved!
Explore an expertly crafted, step-by-step solution for a thorough understanding of key concepts.

This is a popular solution!

Trending now
This is a popular solution!

Step by step
Solved in 2 steps

Knowledge Booster


Learn more about
Need a deep-dive on the concept behind this application? Look no further. Learn more about this topic, statistics and related others by exploring similar questions and additional content below.Recommended textbooks for you
Holt Mcdougal Larson Pre-algebra: Student Edition…
Algebra
ISBN:
9780547587776
Author:
HOLT MCDOUGAL
Publisher:
HOLT MCDOUGAL

Algebra and Trigonometry (MindTap Course List)
Algebra
ISBN:
9781305071742
Author:
James Stewart, Lothar Redlin, Saleem Watson
Publisher:
Cengage Learning
Holt Mcdougal Larson Pre-algebra: Student Edition…
Algebra
ISBN:
9780547587776
Author:
HOLT MCDOUGAL
Publisher:
HOLT MCDOUGAL
Algebra and Trigonometry (MindTap Course List)
Algebra
ISBN:
9781305071742
Author:
James Stewart, Lothar Redlin, Saleem Watson
Publisher:
Cengage Learning