FRED 120 Barrel 115 110 - Crude Oil Prices: West Texas Intermediate (WTI)-Cushing, Oklahoma
FRED 120 Barrel 115 110 - Crude Oil Prices: West Texas Intermediate (WTI)-Cushing, Oklahoma

Functions and Change: A Modeling Approach to College Algebra (MindTap Course List)
6th Edition
ISBN:9781337111348
Author:Bruce Crauder, Benny Evans, Alan Noell
Publisher:Bruce Crauder, Benny Evans, Alan Noell
Chapter3: Straight Lines And Linear Functions
Section3.3: Modeling Data With Linear Functions
Problem 18E: Tax Table Here are selected entries from the 2014 tax table that show the federal income tax owed by...

Related questions
Question
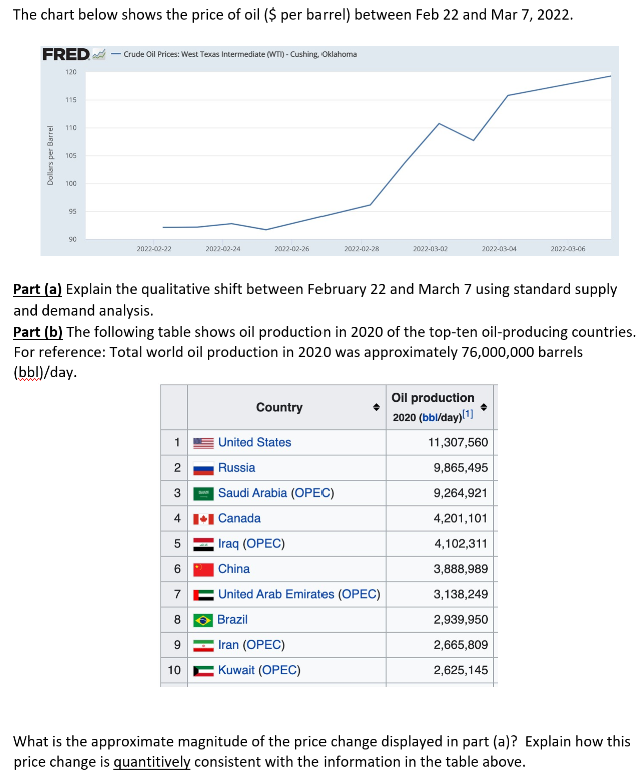
Transcribed Image Text:The chart below shows the price of oil ($ per barrel) between Feb 22 and Mar 7, 2022.
FRED
- Crude Oil Prices: West Texas Intermediate (Wm) - Cushing, Oklahoma
120
115
110
105
100
95
2022-00-22
2022-02-24
2022-02-26
2002-02-28
2002-03-02
2022-03-04
2022-03-06
Part (a) Explain the qualitative shift between February 22 and March 7 using standard supply
and demand analysis.
Part (b) The following table shows oil production in 2020 of the top-ten oil-producing countries.
For reference: Total world oil production in 2020 was approximately 76,000,000 barrels
(bbl)/day.
Oil production
Country
2020 (bbl/day)l1)
United States
11,307,560
2
Russia
9,865,495
3
Saudi Arabia (OPEC)
9,264,921
4 11 Canada
4,201,101
5
Iraq (OPEC)
4,102,311
| China
3,888,989
6
United Arab Emirates (OPEC)
3,138,249
7
8
| Brazil
2,939,950
9
Iran (OPEC)
2,665,809
10
Kuwait (OPEC)
2,625,145
What is the approximate magnitude of the price change displayed in part (a)? Explain how this
price change is quantitively consistent with the information in the table above.
Dollars per Barrel
Expert Solution
This question has been solved!
Explore an expertly crafted, step-by-step solution for a thorough understanding of key concepts.

Step by step
Solved in 3 steps

Recommended textbooks for you
Functions and Change: A Modeling Approach to Coll…
Algebra
ISBN:
9781337111348
Author:
Bruce Crauder, Benny Evans, Alan Noell
Publisher:
Cengage Learning

Functions and Change: A Modeling Approach to Coll…
Algebra
ISBN:
9781337111348
Author:
Bruce Crauder, Benny Evans, Alan Noell
Publisher:
Cengage Learning