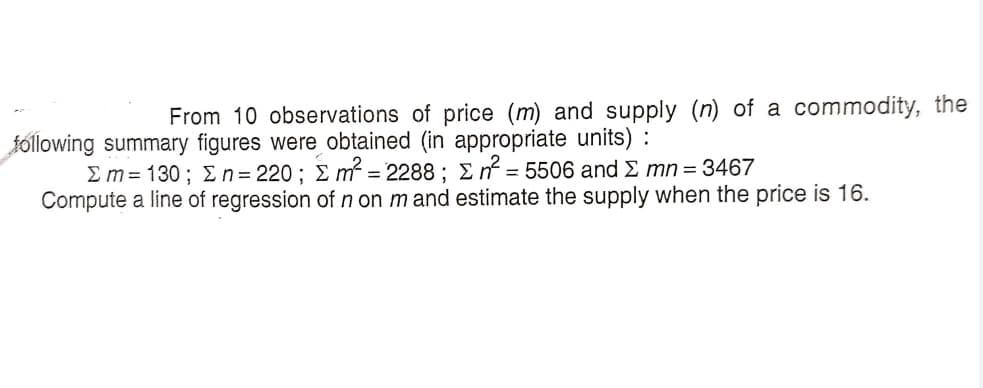
From 10 observations of price (m) and supply (n) of a commodity, the fóllowing summary figures were obtained (in appropriate units) : Σm= 130 ; Σn= 220 ; Σ mr=2288 ; Σην= 5506 and Σ mn= 3467 Compute a line of regression of n on m and estimate the supply when the price is 16.


Q: Which of the following is NOT part of descriptive statistics? (A Collection data (B An inference mad...
A: We know that, The descriptive statistics consists collection of data , summarizing of data and prese...
Q: Which of the following is most likely a population as opposed to a sample? A Every third person to a...
A: Given that, Which of the following is most likely a population as opposed to a sample? A. Every thir...
Q: A random sample of 750 registered voters in Phoenix is asked if they favor the use of oxygenated fue...
A:
Q: 7. Find the proportion area of the region between z = 1.11 and z = -3.15 8. Using the z- table find ...
A: Given that By using standard normal table the z values obtained is
Q: Region Area 0.10 В 0.30 C 0.45 B C 0.15 0 1 2 3 4 6. 8 9 10 11 Use the figure and the table to answe...
A: The probability distribution function gives the probability at each possible value of a continuous r...
Q: Identify if the sentence is population or sample: 1. Score of all students in a math class 2. Numb...
A: The Population is the entire set of items from which you draw data for a statistical study. or Popul...
Q: Average marks in Statistics of 10 students of a class was 68. A new student took admission with 72 m...
A:
Q: You receive a brochure from a large university. The brochure indicates that the mean class size for...
A: Introduction: Denote μ as the true mean class size for full-time faculty.
Q: Confidence intervals on the variance is very sensitive on the nomality of the data while the confide...
A: Confidence Interval for sd is calculated by taking square root of confidence interval for variance.
Q: Suppose 40% of the chocolate bars are $100, 10% are worth $200, 30% are wortg $50, and 20% are worth...
A:
Q: If n = 460 and ˆpp^ (p-hat) = 0.4, construct a 95% confidence interval in excel. Give your answers ...
A:
Q: B. Given the observed valucs below, is there an agreement between the expected and observed ratios? ...
A: The categorical variable is Phenotypes. We have to test whether there is an agreement between the ex...
Q: 4. Suppose X has an exponential distribution with parameter A and that t1, t2 > 0. Prove that X is '...
A:
Q: Fifteen (15) samples of water were collected from a certain treatment facility in order to gain some...
A: Given information: Sample size, n=15 Upper Prediction limit formula: df=n-1=15-1=14 Confidence lev...
Q: standford-binet iq test scores are normally distributed with a mean score of 100 and a standard devi...
A: standford-binet iq test scores are normally distributed with a mean score of 100 and a standard devi...
Q: Calculate the value of mode from the following data: Marks : 10 15 20 25 30 35 40 Frequency 8 12 36 ...
A: The frequency of observation is maximum is called mode
Q: An Association doing charity work decided to give old age pensions to people over sixty years of age...
A:
Q: A company creates wooden furniture to be sold at various retailers. This company claims that only 2....
A: Given : Sample size (n) = 890 Let X : No. of defective furniture pieces X = 47 Significance level (...
Q: Calculate Quartile Deviation and its Coefficient from the following data : Weight (in pounds) 120 12...
A:
Q: CI on Mean, Variance Unknown, Prediction and Tolerance Interval A CNC (computer numerical control) m...
A: sample mean 'x̄= 1.0056 sample size n= 9 std deviation s= 0.0246 std error ='sx=s/√n=...
Q: How do I find the population mean (not the sample mean) in order to solve for t? (Second page)
A: Hypothesis testing uses data from a sample to draw conclusions about a pop.
Q: For a binomial random variable with a mean of 20 and 100 trials, what is the standard deviation?
A: For a binomial random variable with a mean of 20 and 100 trials, what is the standard deviation?
Q: 75 voters are asked to rank four brands of cereal: A, B, C, and D. The votes are summarized in the f...
A: Using plurality method, Brand D is fourth choice in 3 cases. So D doesn't win. We see that C is 3rd...
Q: The number of typhoon occurring in the Philippines in a particular month is known to conform to the ...
A: Given,standard deviation of the poisson distribution is 2so, λ=2λ=4A random variable X~Poisson(λ=4)P...
Q: Identify if the sentence is Cluster Sampling, Stratified Sampling, or Simple Random Sampling 1. Sup...
A: 1. Simple random sampling. Explanation : Here the box contains the items which are numbered from 1-...
Q: 90 voters are asked to rank four brands of cereal: A, B, C, and D. The votes are summarized in the p...
A: Plularity elimation method is used to decide the winner of the election. It is based on the least el...
Q: In a survey of 300 students of a college, it was found that 49% liked watching football, 53% liked w...
A: The survey of 300 students of a college is conducted for study of how many students like watching fo...
Q: In a population that is normally distributed with a mean X and standard deviation Y, determine the a...
A:
Q: Estimate the probability that the store will gross over $850 at least 6 out of 10 business days. a...
A: here as per guidelines i have calculated 3 subparts plz repost for remaining Trevor is interested in...
Q: You are conducting a quantitative research on the study habits and academic performance of the Senio...
A: From the provided information, Standard deviation (σ) = 8 Confidence level = 95% Margin of error (E)...
Q: A survey of randomly selected university students found that 91 of the 101 first-year students and 9...
A:
Q: Calculate the probability that the advertisements are clicked on at least 10 times in a one minute p...
A: A company advertise their products on Instagram. The number of times their advertisements are clicke...
Q: A between-subjects experiment with 25 scores in treatment I and 25 scores in treatment II must have ...
A: In Between subject, each observation is independent of the other observation. Each participant has e...
Q: Which of the following best describes the sampling distribution of the sample means. a.It is the pr...
A: The sample means follows normal distribution with mean μx=μ and SD σx=σn
Q: Given a standard normal curve, determine the approximate value of P(2.43<z<1.26). * 0.8887 0.0963 0....
A: We have given that We have given that. X~N( μ , ?^2 ) μ =0 , ? =1 for standard normal Z-sco...
Q: Give a 99% confidence interval, for μ1−μ2μ1-μ2 given the following information. n1=35n1=35, ¯x1=2.6...
A: There are two independent samples which follows normal distribution. We have to construct 99% confid...
Q: Answer the following question by using a combination or a permutation. how many different ways can 3...
A: Combination: It is nothing but the objects are being selected when the order of selection is not ...
Q: Suppose an interval has frequency f. If the class interval with the lowest value is at the lowest ro...
A: A frequency is the no. of times a data value occurs.
Q: A police officer waits on a road to catch speeding cars. In a one hour sample, the officer find that...
A:
Q: (X), E(Y ) EXY), Cov(X, Y) , σχ, σχ and Py.
A:
Q: Find the mean from the following data : 10 15 20 25 30 35 40 f 5 9 13 21 20 15 8 3
A:
Q: One-Sample Z: Test of u = 35 vs not = 35 The assumed standard deviation = 1.8 Variable N Mean StDev ...
A: GivenTest of μ=35 vs not = 35The ssumed standard deviation(σ)=1.8N=25Mean =35.710
Q: Two samples are taken with the following numbers of successes and sample sizes r1r1 = 22 r2r2 = 30 n...
A: It is given that For first sample, sample size n1 = 83, number of successes r1 = 22 For second sampl...
Q: 1. Write down the multiple regression function? 2. What is the multiple correlation and the multiple...
A: From the output, the constant value is 1.210.
Q: 14. If b b. Ox and be regression coefficients of x on y and y on x and correlation coefficient respe...
A:
Q: p (sample proportion) is the proportion of observation, with population size N that belongs to a cla...
A: False is the answer. Sample proportion is the proportion of observation,with sample size 'n' that b...
Q: B increases as µ deviates from µo when Ho is false True O False
A: The provided statement is "False".
Q: The average score of boys is 60, that of girls is 70 and that of all the candidates is 64 appearing ...
A:
Q: STATISTICAL ANALYSIS (No long explanation needed. Rate will be given and write the complete solution...
A: sample mean 'x̄= 1.0056 sample size n= 9 std deviation s= 0.0246 std error =Sx 0.0082...
Q: Question 2: A town's department of public works is concerned about adverse public reaction to a sewe...
A: Solution:

Step by step
Solved in 3 steps with 3 images

- Find the equation of the regression line for the following data set. x 1 2 3 y 0 3 4The following fictitious table shows kryptonite price, in dollar per gram, t years after 2006. t= Years since 2006 0 1 2 3 4 5 6 7 8 9 10 K= Price 56 51 50 55 58 52 45 43 44 48 51 Make a quartic model of these data. Round the regression parameters to two decimal places.Olympic Pole Vault The graph in Figure 7 indicates that in recent years the winning Olympic men’s pole vault height has fallen below the value predicted by the regression line in Example 2. This might have occurred because when the pole vault was a new event there was much room for improvement in vaulters’ performances, whereas now even the best training can produce only incremental advances. Let’s see whether concentrating on more recent results gives a better predictor of future records. (a) Use the data in Table 2 (page 176) to complete the table of winning pole vault heights shown in the margin. (Note that we are using x=0 to correspond to the year 1972, where this restricted data set begins.) (b) Find the regression line for the data in part ‚(a). (c) Plot the data and the regression line on the same axes. Does the regression line seem to provide a good model for the data? (d) What does the regression line predict as the winning pole vault height for the 2012 Olympics? Compare this predicted value to the actual 2012 winning height of 5.97 m, as described on page 177. Has this new regression line provided a better prediction than the line in Example 2?
- In order to determine a realistic price for a new product that a company wants to market the company’s research department selected 10 sites thought to have essentially identical sales potential and offered the product in each at a different price. The resulting sales are recorded in the accompanying table: Price ($) Sales ($1,000s) 15.00 15 15.50 14 16.00 16 16.50 9 17.00 12 17.50 10 18.00 8 18.50 9 19.00 6 19.50 5 h). Estimate the slope of the actual equation of the regression line using a 95% confidence interval and interpret this interval.In order to determine a realistic price for a new product that a company wants to market the company’s research department selected 10 sites thought to have essentially identical sales potential and offered the product in each at a different price. The resulting sales are recorded in the accompanying table: Price ($) Sales ($1,000s) 15.00 15 15.50 14 16.00 16 16.50 9 17.00 12 17.50 10 18.00 8 18.50 9 19.00 6 19.50 5 h). Estimate the slope of the actual equation of the regression line using a 95% confidence interval and interpret this interval using Minitab.A U.S. state's Bureau of Economic Geology published a study on the economic impact of using carbon dioxide enhanced oil recovery (EOR) technology to extract additional oil from fields that have reached the end of their conventional economic life. The following table gives the approximate number of jobs for the citizens that would be created at various levels of recovery. Percent Recovery (%) 20 40 80 100 Jobs Created (Millions) 6 9 12 18 Find the regression line. j(r) = Use the regression line to estimate the number of jobs that would be created at a recovery level of 60%. _____ million jobs
- Consider the following estimated regression model relating annual salary to years of education and work experience. Estimated Salary=10,737.30+2872.43(Education)+1129.1(Experience)Estimated Salary=10,737.30+2872.43(Education)+1129.1(Experience) Suppose an employee with 44 years of education has been with the company for 1111 years (note that education years are the number of years after 8th8th grade). According to this model, what is his estimated annual salary?The following are data on the average weekly profits(in $1,000) of five restaurants, their seating capacities, andthe average daily traffic (in thousands of cars) that passestheir locations: Seating Traffic Weekly netcapacity count profitx1 x2 y120 19 23.8200 8 24.2150 12 22.0180 15 26.2240 16 33.5 (a) Assuming that the regression is linear, estimate β0, β1,and β2.(b) Use the results of part (a) to predict the averageweekly net profit of a restaurant with a seating capacityof 210 at a location where the daily traffic count averages14,000 cars.A study of the amount of rainfall and the quantity of air pollution removed produced the following data shown in table below: Daily Rainfall x (0.01 cm) Particulate Removed y (μg/m3) 7 126 7.9 129.3 7.5 125.3 9.2 120.2 10.8 116.7 5.8 119.2 5.6 138.7 2.7 147.5 9.2 110.3 Plot a scatter diagram. Find the equation of the regression line to predict (y) for the particulate removed from the amount of daily rainfall.
- The table contains data on vehicle speed (h) and fuel consumption (lt / 100km) of 5 randomly selected vehicles. Estimate the average fuel consumption of a vehicle traveling at 45 km / h using the simple linear regression equation between vehicle speed and fuel consumption. Speed 55 60 65 70 75 Consumption 13 12 11 10 9 a. 15 b. 8 c. 7 d. 20A group of students measure the length and width of a random sample of beans. They are interested in investigating the relationship between the length and width. Their summary statistics are displayed in the table below. All units, if applicable, are millimeters. Mean width: 7.555 Stdev width: 0.914 Mean height: 12.686 Stdev height: 1.634 Correlation coefficient: 0.8203 d) If the students are interested in using the height of the beans to predict the width, calculate the slope of this new regression equation. e) Write the equation of the best-fit line that can be used to predict bean widths. Use x to represent height and y to represent width.Given below are results from the regression analysis where the dependent variable is the number of weeks a worker is unemployed due to a layoff (Unemploy) and the independent variables are the age of the worker (Age), the number of years of education received (Edu), the number of years at the previous job (Job Yr), a dummy variable for marital status (Married: 1=married, 0=otherwise), a dummy variable for head of household (Head: 1=yes, 0=no) and a dummy variable for management position (Manager: 1=yes, 0=no). We shall call this Model 1. The coefficient of partial determination (R2Yj.(All variables except j)) of each of the six predictors are, respectively, 0.2807, 0.0386, 0.0317, 0.0141, 0.0958, and 0.1201. Model 2 is the regression analysis where the dependent variable is Unemploy and the independent variables are Age and Manager. The results of the regression analysis are given. Refer to model 1. Which of the following is the correct null hypothesis to test…


