From generation to generation, the average age when smokers first start to smoke varies. However, the standard deviation of that age remains constant at around 2.1 years. A survey of 37 smokers of this generation was done to see if the average starting age is at least 19. The sample average was 18.1 with a sample standard deviation of 1.3. Do the data support the claim at the 5% level? Note: If you are using a Student's t-distribution for the problem, you may assume that the underlying population is normally distributed. (In general, you must first prove that assumption, though.) O Part (a) O Part (b) O Part (c) O Part (d) O Part (e) O Part (f) O Part (g) O Part (h) O Part (i) Construct a 95% confidence interval for the true mean. Sketch the graph of the situation. Label the point estimate and the lower and upper bounds of the confidence interval. (Round your lower and upper bounds to two decimal places.) 95% C.I.
From generation to generation, the average age when smokers first start to smoke varies. However, the standard deviation of that age remains constant at around 2.1 years. A survey of 37 smokers of this generation was done to see if the average starting age is at least 19. The sample average was 18.1 with a sample standard deviation of 1.3. Do the data support the claim at the 5% level? Note: If you are using a Student's t-distribution for the problem, you may assume that the underlying population is normally distributed. (In general, you must first prove that assumption, though.) O Part (a) O Part (b) O Part (c) O Part (d) O Part (e) O Part (f) O Part (g) O Part (h) O Part (i) Construct a 95% confidence interval for the true mean. Sketch the graph of the situation. Label the point estimate and the lower and upper bounds of the confidence interval. (Round your lower and upper bounds to two decimal places.) 95% C.I.

Glencoe Algebra 1, Student Edition, 9780079039897, 0079039898, 2018
18th Edition
ISBN:9780079039897
Author:Carter
Publisher:Carter
Chapter10: Statistics
Section10.3: Measures Of Spread
Problem 26PFA

Related questions

Question
Transcribed Image Text:From generation to generation, the average age when smokers first start to smoke varies. However, the standard deviation of that age remains constant at around 2.1 years. A survey of 37 smokers
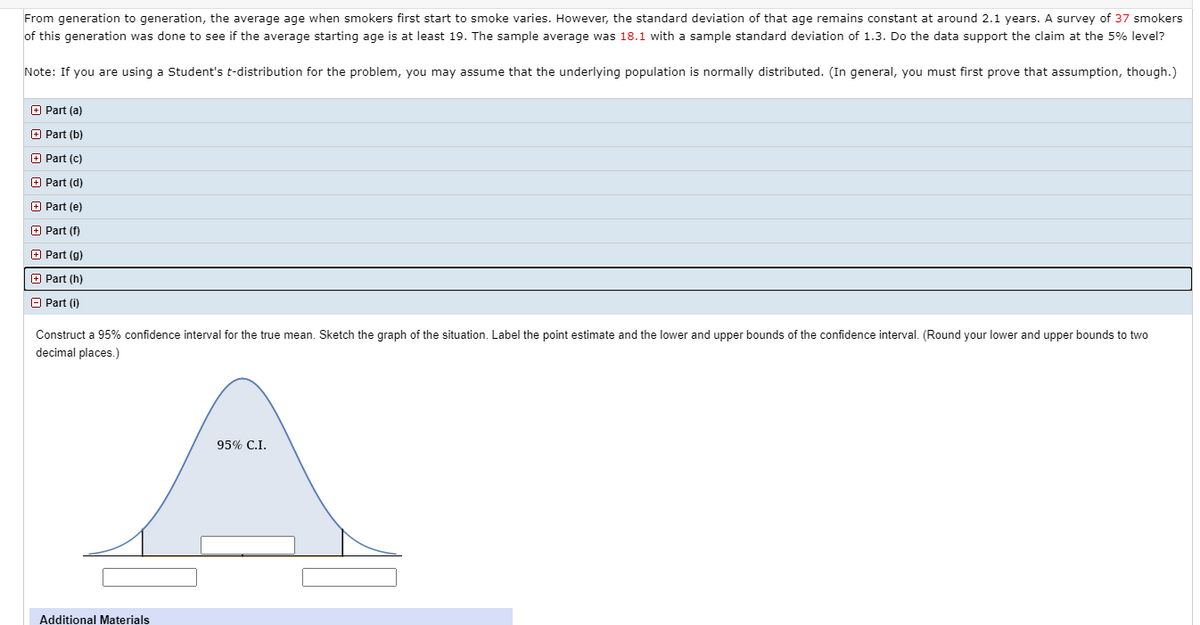
of this generation was done to see if the average starting age is at least 19. The sample average was 18.1 with a sample standard deviation of 1.3. Do the data support the claim at the 5% level?
Note: If you are using a Student's t-distribution for the problem, you may assume that the underlying population is normally distributed. (In general, you must first prove that assumption, though.)
O Part (a)
O Part (b)
O Part (c)
O Part (d)
O Part (e)
O Part (f)
O Part (g)
+ Part (h)
O Part (i)
Construct a 95% confidence interval for the true mean. Sketch the graph of the situation. Label the point estimate and the lower and upper bounds of the confidence interval. (Round your lower and upper bounds to two
decimal places.)
95% C.I.
Additional Materials
Expert Solution
This question has been solved!
Explore an expertly crafted, step-by-step solution for a thorough understanding of key concepts.

This is a popular solution!

Trending now
This is a popular solution!

Step by step
Solved in 2 steps with 2 images

Knowledge Booster


Learn more about
Need a deep-dive on the concept behind this application? Look no further. Learn more about this topic, statistics and related others by exploring similar questions and additional content below.Recommended textbooks for you
Glencoe Algebra 1, Student Edition, 9780079039897…
Algebra
ISBN:
9780079039897
Author:
Carter
Publisher:
McGraw Hill
Glencoe Algebra 1, Student Edition, 9780079039897…
Algebra
ISBN:
9780079039897
Author:
Carter
Publisher:
McGraw Hill