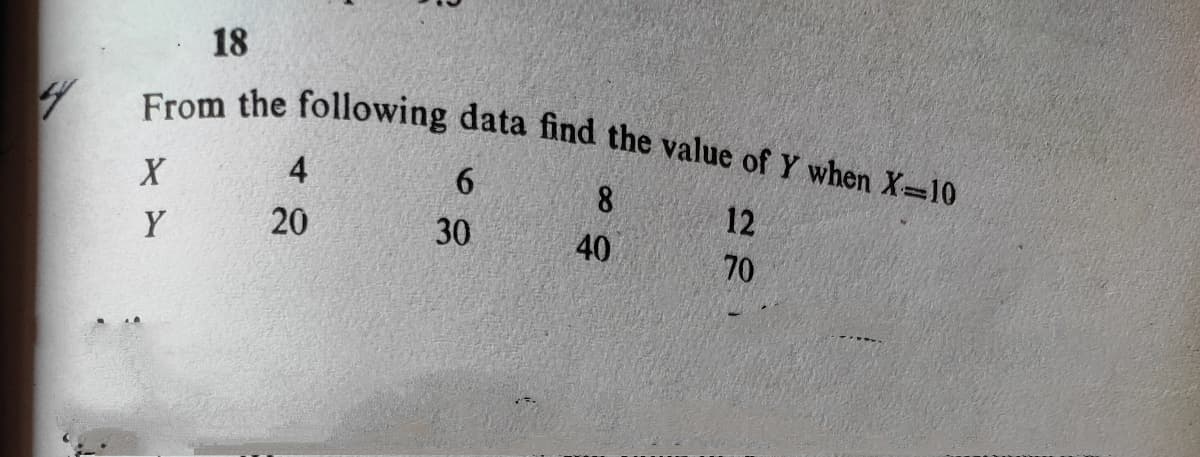
From the following data find the value of Y when X-10 18 4 8. 12 Y 20 30 40 70


Q: Suppose X ~ N (-2,3). Between what c values does 99.73% of the data lie?
A: The mean is -2 and the standard deviation is 3.
Q: What is the missing value for y on the diagram below? 4
A: Using the secant-secant formula we get: AB×BD=BC×BE
Q: For a population with μ = 80 and σ = 10,what is the X value corresponding to z = -0.50?
A: Given information Mean (µ) = 80 Standard Deviation(σ) = 10 Z = -0.50 Z-score is given by the…
Q: Kenny is a director of nursing in a hospital and wonders if the number of visitors a patient has…
A:
Q: As concrete cures it gains strength. The following data represents the 7 day and 28 day Ustrength…
A: Given: The data given is as follows x y 2300 4070 3390 5220 2430 4640 2890 4620 3330…
Q: Q2) The following data represents the results of an experimental test, if the relation between…
A: The given data is x y 4 13 7 10 12 9 15 7 24 4
Q: In the following data, x is the average number of hours the student spent working on math each week…
A:
Q: Given the following data, find the value of D3
A:
Q: For the data : 9 2 10 33 62 the mean is the best measure of central tendency to describe the data. O…
A: The data is 9, 2, 10, 33, 1, 62.
Q: Given the table below representing IQ (x) and GPA (y), find the equation of the line that best fits…
A: Thanks for the question. For the given data values, the correct regression equation is y=0.04x-1.35.…
Q: Which function best fits the data shown in this scatter plot? O A. Ax) = x B. Kx) = x C. Ax) = 2* D.…
A: Given data of scattering points are Note that (1,2) satisfy the given data.
Q: Use the given data test the indicated X S a Me 10 191 96.7 37.5 0.05 M²90
A: Given that n=191 x=96.7s=37.5α=0.05
Q: Which of the following descriptions best and most completely describes the relationship variables…
A: The scatterplot is given. Scatterplot shows association between two variables.
Q: y = a + bx to the following data 25 19 50 36 76 85 80 40 82 45 83 2. Fit a straight line 30 79
A:
Q: For the following example indicate the type of data involved using the following: A = nominal data…
A: Nominal data: Nominal data measure qualitative data and it is the name of variable. example: Smoking…
Q: Q. 4. Fit a straight line from the following data Years : Sales (1000) : 1989 1990 1991 1992 12 15…
A: Given that Years 1989 1990 1991 1992 Sales 12 15 17 22 Then we have to fit the straight…
Q: For the scatterplot shown below, what y value would you expect to be paired with x = 9? 800 700 600…
A: We have given a scatterplot . And have to find What value would we expect to be paired with x=9 ?…
Q: The following data pertains to the heights of fathers and their eldest sons in inches. x- height of…
A: Given, No. XZ Y 1 71 71 2 69 69 3 69 71 4 65 68 5 66 68 6 63 66 7 68 70 8 70 72…
Q: For Exercise, use the given data to find a variation model relating y to x. B х 2 12 48 2 У 0.25
A: Variation: Variation problems involves simple relationships or formulas, involving one variable…
Q: Answer the question below by clicking on the correct response. y 50 40 30 20 10- 0+ 4 8 10 12 The…
A: equation of line passing through two points ( x1 , y1) and (x2, y2) y= y1 = y2-y1x2-x1(x-x1)
Q: 1- Fit a straight line to the given data regarding x as the independent variable. 2 3 1 4 6 y 1200…
A:
Q: 15 From the data given below find out the value of Y when X=35 10 20 30 40 Y 50 60 70 90 joL
A:
Q: In 1996, the average price of a commodity was 20% more than that in 1995, but 20% less than that in…
A: Solution is given in the photo:
Q: A researcher would like to know if IQ scores are related to age. Using 10 high school students, he…
A: We have given that A random sample of size 10 of high school students. Computed r is 0.58 and level…
Q: In the following data, x is the average number of hours the student spent working on math each week…
A: x= average number of hours on each week y=final grade in math
Q: Consider the following data relating hours spent studying (X) and average grade on course quizzes…
A: The table shows the hours spent studying and the average grade on course quizzes.
Q: find the mode for the given data x f 1 2 2 7 3 5 4 4 5 3 6 4 7 5 8 7 9 2…
A: Frequency table consist the data values along with its frequencies. Frequency table is more…
Q: Given the following table, give the best estimate for f'(3) 6 9. 12 15 f(x) 38 43 55 60 22 3
A: Since you have asked multiple question, we will solve the first question for you as per our guide…
Q: The table below shows the relationship between the temperature of the day and the corresponding…
A: Given: Temperature (in degree Fahrenheit) 54 59 63 72 Number of Juice Cans Sold 350 365 405 450
Q: Without doing any calculations, what type of a relationship exists between the pairs of…
A: Given: The data given is as follows X Y 2 128 20 72 3 144 18 81 1 142
Q: For the data set below, use the graph to determine if 14.4 59 134.4 420 700,4 2. 3. 4 6. AYs…
A: y 14.4 59 134.4 420 700.4 x 2 3 4 6 7 Using graph To determine whether y is proportional to…
Q: Given the following information, describe the variation. x3 1.5 0.5 0.3 5 10 30 50
A:
Q: For the data in the following table, what is the value of ΣX? X f 4 2 3 2 2 4 1 2
A: The given table is a frequency table.
Q: For the given data, find the value of each expression: X Y 8 5 -4 1 6. -2 E(6XY - 4)2 - 15 =||…
A:
Q: Q.5 Fit a straight line of the best fit from the following data. Year Imports 2011 | 2012 | 2013 |…
A: Therefore, using excel software fit a straight line of the given data by using following steps,…
Q: In 1976 the average price of a commodity was 20% more than in 1975. but 20% less than in 1974 and it…
A:
Q: The city of wishes to see if there is a relationship between the temperature and the amount of…
A: The given data is: x y 73 680 78 760 85 910 98 1510 93 1170 81 837 76 600 105…
Q: There is another research on the relationship between average daily earnings and age. ADE = -15 +…
A: Note: "Since you have posted multiple questions, we will solve the first question for you. If you…
Q: For which of the x-values should you NOT attempt to estimate the y because of extrapolation? 20 60…
A: Given Information: From the given graph, the data points are, 9,1,41,3,55,4,69,5,75,5,83,6
Q: In 1997, the average price of a group of items was 25% more than in 1996 but 25% less than in 1995…
A:
Q: For the following bookstore sales data, the correlation is 0.965. Number of Salespeople Working…
A: g) Compute the slope of the regression line using the formula: b=rsysx Where, 'r' is the correlation…
Q: In order for applicants to work for the foreign-service department, they must take a test in the…
A:
Q: Complete the following statements. a. In general, % of the values in a data set lie at or below the…
A: We have to answer questions based on the definition of percentile.
Q: For the following example indicate the type of data involved using the following: A = nominal data…
A: Scale of measurement used to measure the variable. It is used to measure the discrete and continuous…
Q: Use the following to answer the question: ˆy=−4x+10.3 with R2=35%. Which best describes the…
A: Obtain the value of the correlation. The value of the correlation is obtained below as follows:…
Q: The correlation between the heights ( measured in inches ) of brothers and the heights of their…
A: Solution Given the correlation between the height of brothers and the heights of their sister is r=…
Q: Given the data as shown in the table below X Y 2 12 3 10 4 9 10 Use technology to graph the…
A: As it is mentioned to use technology, I am using MS Excel and will provide all the steps.

Step by step
Solved in 2 steps with 2 images

- Consider the following data relating hours spent studying (X) and average grade on course quizzes (Y): X Y 5 6 3 8 4 8 7 10 5 7 6 9 Compute: ExEy/n 1140 6 240 235Consider the following data relating hours spent studying (X) and average grade on course quizzes (Y): X Y 5 6 3 8 4 8 7 10 5 7 6 9 Compute rConsider the following data relating hours spent studying (X) and average grade on course quizzes (Y): X Y 5 6 3 8 4 8 7 10 5 7 6 9 Compute ΣXY 240 245 252 225
- Calculate the value of “x” from the following figure.Find E(X) and if students pay $500 per course plus a $100 per-semester registration fee., What is the average amount of money the university can expect to make from a student each a semester?For a population with μ =100 and σ = 20, what is the X value corresponding to z = -0.50?
