from the split data. c

Glencoe Algebra 1, Student Edition, 9780079039897, 0079039898, 2018
18th Edition
ISBN:9780079039897
Author:Carter
Publisher:Carter
Chapter4: Equations Of Linear Functions
Section4.5: Correlation And Causation
Problem 11PPS

Related questions
Question
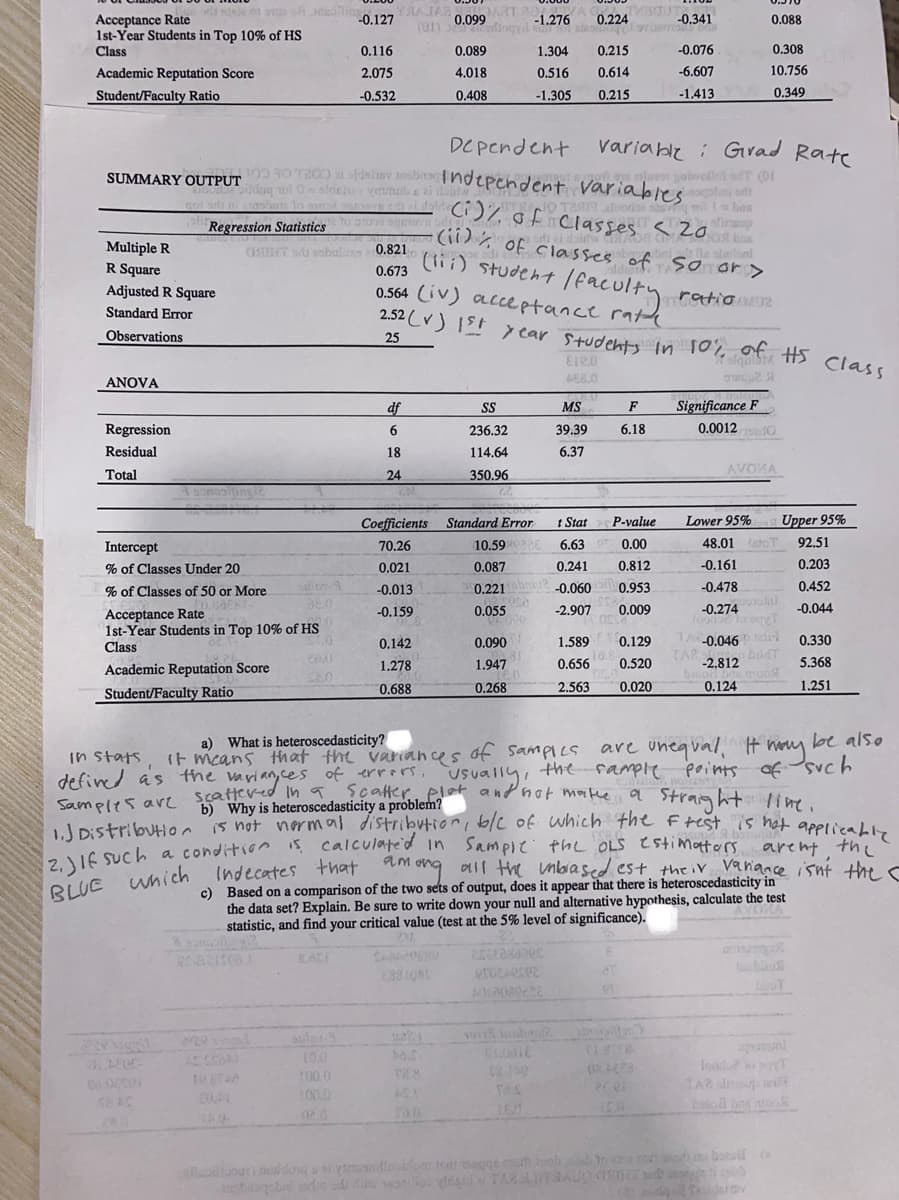
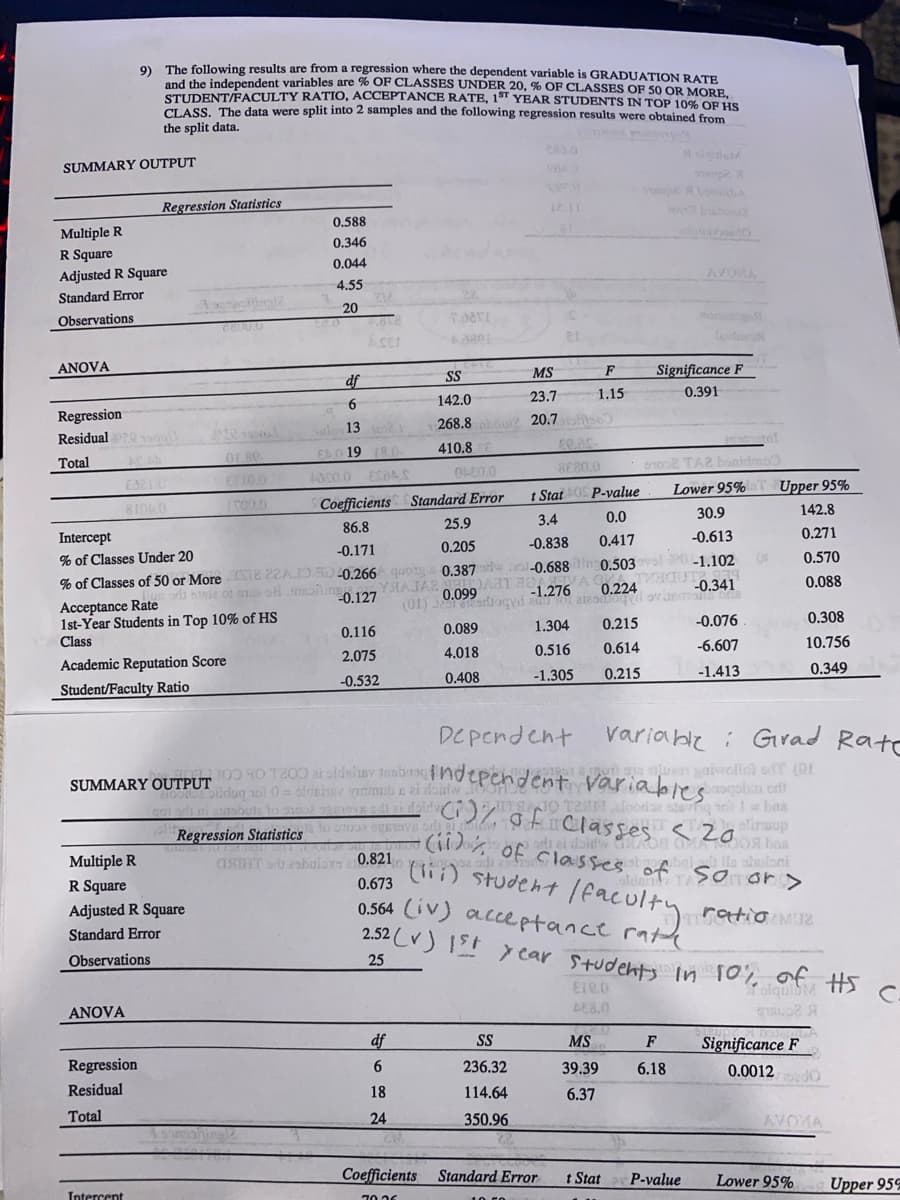
9) The following results are from a regression where the dependent variable is GRADUATION RATE and the independent variables are % OF CLASSES UNDER 20, % OF CLASSES OF 50 OR MORE, STUDENT/FACULTY RATIO, ACCEPTANCE RATE, 1ST YEAR STUDENTS IN TOP 10% OF HS CLASS. The data were split into 2 samples and the following regression results were obtained from the split data.
c) Based on a comparison of the two sets of output, does it appear that there is heteroscedasticity in the data set? Explain. Be sure to write down your null and alternative hypothesis, calculate the test statistic, and find your critical value (test at the 5% level of significance).
Transcribed Image Text:Samples ar Scatteved In a. Scater.. elet and not moitke a Straight li re,
-0.127
A0224
-1.276
2.52 (V) 1 year Students In 10% of HS Class
ART
0.099
Acceptance Rate
1st-Year Students in Top 10% of HS
Class
-0.341
0.088
(01)
Ioviem
0.116
0.089
1.304
0.215
-0.076
0.308
Academic Reputation Score
2.075
4.018
0.516
0.614
-6.607
10.756
Student/Faculty Ratio
-0.532
0.408
-1.305
0.215
-1.413
0.349
DC pendent
variable : Girad Rate
30 T200 ai sldsiay anb ndependent Variables
Odog ol 0 eldeh verutuba ai doin
SUMMARY OUTPUT
olini ods
ig mi lbas
alimaup
obeloni
(ii) % of classes of so or>
Ci)% of Classes <20 ibian
NOT2AM bodia
n alasbut lo a
Regression Statistics
Multiple R
(l) student leaculty
0.564 (iv) acceptance rat
asmT bulox 0.821
la
R Square
0.673
Adjusted R Square
ratioa2
Standard Error
Observations
25
ANOVA
LEB.0
df
SS
MS
F
Significance F
Regression
236.32
39.39
6.18
0.0012
Residual
18
114.64
6.37
AVOKA
Total
24
350.96
22
Coefficients Standard Error
t Stat P-value
Lower 95% g Upper 95%
Intercept
70.26
10.59
6.63 Or 0.00
48.01 atoT
92.51
% of Classes Under 20
0.021
0.087
0.241
0.812
-0.161
0.203
% of Classes of 50 or More
alloa
-0.013
0.221
-0.060 0.953
-0.478
0.452
-0.274
Too2 lo T
-0.046 i
-0.159
0.055
-2.907
0.009
-0.044
Acceptance Rate
1st-Year Students in Top 10% of HS
Class
0.142
0.090
1.589
0.129
0.330
10.8
0.520
TA2
budT
1.278
1.947
0.656
-2.812
5.368
Academic Reputation Score
0.688
0.268
2.563
0.020
0.124
1.251
Student/Faculty Ratio
a) What is heteroscedasticity?
be also
it means thnat the variances of sampics are unequal, H
defined as the varian, ces of errers Usually, the sample points of uch
In Stats
Samples are scaftered Ih9 cafterelet andnot matee a
b) Why is heteroscedasticity a problem?
Stranght
lime.
1J Distribuion is not nermal distributioribc of which the frest is hat applicaba
is calculate'd in Sampie thL OLS Cstimators
arent the
eng all the nbiased est theiY vanance isnt the s
Indecates that
c) Based on a comparison of the two sets of output, does it appear that there is heteroscedasticity in
the data set? Explain. Be sure to write down your null and alternative hypothesis, calculate the test
statistic, and find your critical value (test at the 5% level of significance).
BLUE unich
8.A1
382080e10
L0.0
Iood 2 o
T00 0
00.0
02.0
llungnaldog nlloolo teds ecge ch 2oob r a o bod e
Transcribed Image Text:1st year Students In 10% of
9 The following results are from a regression where the dependent variable is GRADUATION RATE
and the indenendent variables are % OF CLASSES UNDER 20, % OF CLASSES OF 50 OR MORE.
STUDENT/EACULTY RATIO, ACCEPTANCE RATE, 1ST YEAR STUDENTS IN TOP 10% OFUS
CLASS. The data were split into 2 samples and the following regression results were obtained from
the split data.
283.0
SUMMARY OUTPUT
cern
Regression Statistics
12.11
0.588
Multiple R
0.346
R Square
0.044
Adjusted R Square
AVOMA
4.55
Standard Error
20
Observations
no
320
ANOVA
MS
F
Significance F
df
S
142.0
23.7
1.15
0.391
6
Regression
Residual go
268.8 20.7
saln13
ELO 19 18.0-
410.8
Total
Or 80-
anoe TA2 bonidmo
SE80.0
E3210
t Stat 0S P-value
Lower 95% Upper 95%
Coefficients Standard Error
25.9
30.9
142.8
3.4
0.0
Intercept
86.8
-0.613
0.271
0.205
-0.838
0.417
-0.171
% of Classes of 50 or More 2 2AD SD0.266 quots 0.387arw-0.688in 0.503vol dPO 1.102
UTa
-0.341
% of Classes Under 20
0.570
0.088
0.224
NDEAL
-1.276
0.099
(01) earsogyd 20o
-0.127
Acceptance Rate
1st-Year Students in Top 10% of HS
Class
0.215
-0.076
0.308
0.116
0.089
1.304
0.516
0.614
-6.607
10.756
2,075
4.018
Academic Reputation Score
0.349
-0.532
0.408
-1.305
0.215
-1.413
Student/Faculty Ratio
De pendent
Variabe i Girad Rate
gor ga n aivweliol ofT (OI
O T200 at sldelay nabitcndependent Variablesoqol ed
SUMMARY OUTPUT
opildug ol 0= olrin vmmub e zi doilwoor
NO T2Mfoorize svng toi I baa
oliraup
asbuta lo sno0
IT
Regression Statisticsto uroa ogeva orl
ASIHT oru 2sbuloxo 0.821
0.673
a adi a
(i) student (eaculty
ardi ai doidw Roa AOOA bas
(iD of classes of so or>
Multiple R
shuloni
R Square
0.564 (iv) acceptance rat
Adjusted R Square
ratio MU2
2.52 (V) 1st year students in 10% of Hs c.
Standard Error
Observations
25
TolquibM
ANOVA
LE8.0
df
SS
MS
F
Significance F
Regression
6.
236.32
0.0012 JO
39.39
6.18
Residual
18
114.64
6.37
Total
24
350.96
AVOMA
Coefficients Standard Error
t Stat
P-value
Lower 95%
g Upper 95S
Intercent
70 26
10 C
Expert Solution
This question has been solved!
Explore an expertly crafted, step-by-step solution for a thorough understanding of key concepts.

Step by step
Solved in 2 steps

Recommended textbooks for you
Glencoe Algebra 1, Student Edition, 9780079039897…
Algebra
ISBN:
9780079039897
Author:
Carter
Publisher:
McGraw Hill

Big Ideas Math A Bridge To Success Algebra 1: Stu…
Algebra
ISBN:
9781680331141
Author:
HOUGHTON MIFFLIN HARCOURT
Publisher:
Houghton Mifflin Harcourt
Glencoe Algebra 1, Student Edition, 9780079039897…
Algebra
ISBN:
9780079039897
Author:
Carter
Publisher:
McGraw Hill
Big Ideas Math A Bridge To Success Algebra 1: Stu…
Algebra
ISBN:
9781680331141
Author:
HOUGHTON MIFFLIN HARCOURT
Publisher:
Houghton Mifflin Harcourt