Fuel Economy, Minivans - The Environmental Protection Agency (EPA) publishes fuel economy values that are known to be good estimates of the fuel conomy a typical driver will achieve under average driving conditions. One of the fuel economy values the EPA publishes is a combined estimate, vhich represents a combination of city driving (55%) and highway driving (45%). oyota Sienna, a popular minivan, advertises an average combined fuel usage of 22 mpg. A large rental company collected the information about combined fuel economy (mpg) for their 10 Toyota Sienna minivans. The results are shown in the table below. 21.7 21 21.9 20.4 21.8 21.6 22.5 20.8 23.5 21.1 he company calculates the sample mean to be 21.63 and sample standard deviation as 0.897. Round all calculated values to 4 decimal places as appropriate. . The management believes that Toyota has overestimated the fuel economy of the Sienna. Which set of hypotheses should we use to determine if the uel efficiency of the Sienna is less than what is advertised? ОА. Но : и %3D 22 vs. Ha : и # 22 Ов. Но : и %3D 22 vs. Ha : и < 22 ос. Но : и 3D 22 vs. Ha : и> 22
Fuel Economy, Minivans - The Environmental Protection Agency (EPA) publishes fuel economy values that are known to be good estimates of the fuel conomy a typical driver will achieve under average driving conditions. One of the fuel economy values the EPA publishes is a combined estimate, vhich represents a combination of city driving (55%) and highway driving (45%). oyota Sienna, a popular minivan, advertises an average combined fuel usage of 22 mpg. A large rental company collected the information about combined fuel economy (mpg) for their 10 Toyota Sienna minivans. The results are shown in the table below. 21.7 21 21.9 20.4 21.8 21.6 22.5 20.8 23.5 21.1 he company calculates the sample mean to be 21.63 and sample standard deviation as 0.897. Round all calculated values to 4 decimal places as appropriate. . The management believes that Toyota has overestimated the fuel economy of the Sienna. Which set of hypotheses should we use to determine if the uel efficiency of the Sienna is less than what is advertised? ОА. Но : и %3D 22 vs. Ha : и # 22 Ов. Но : и %3D 22 vs. Ha : и < 22 ос. Но : и 3D 22 vs. Ha : и> 22

Holt Mcdougal Larson Pre-algebra: Student Edition 2012
1st Edition
ISBN:9780547587776
Author:HOLT MCDOUGAL
Publisher:HOLT MCDOUGAL
Chapter11: Data Analysis And Probability
Section11.5: Interpreting Data
Problem 9E

Related questions

Question
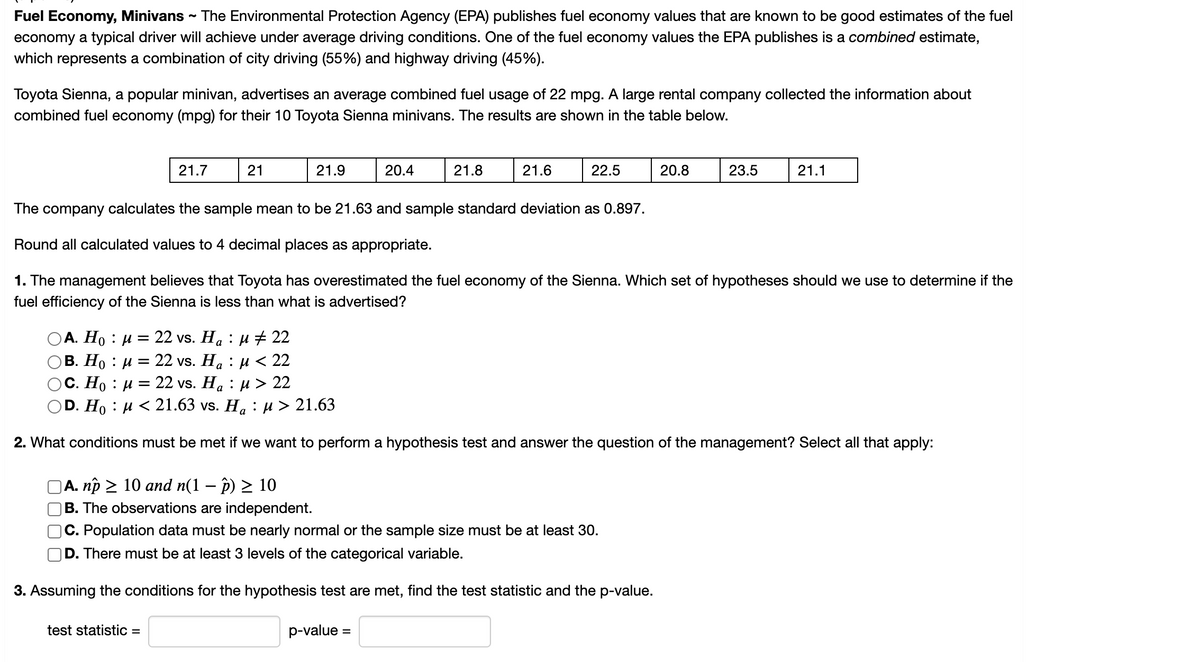
Transcribed Image Text:Fuel Economy, Minivans - The Environmental Protection Agency (EPA) publishes fuel economy values that are known to be good estimates of the fuel
economy a typical driver will achieve under average driving conditions. One of the fuel economy values the EPA publishes is a combined estimate,
which represents a combination of city driving (55%) and highway driving (45%).
Toyota Sienna, a popular minivan, advertises an average combined fuel usage of 22 mpg. A large rental company collected the information about
combined fuel economy (mpg) for their 10 Toyota Sienna minivans. The results are shown in the table below.
21.7
21
21.9
20.4
21.8
21.6
22.5
20.8
23.5
21.1
The company calculates the sample mean to be 21.63 and sample standard deviation as 0.897.
Round all calculated values
4 decimal places as appropriate.
1. The management believes that Toyota has overestimated the fuel economy of the Sienna. Which set of hypotheses should we use to determine if the
fuel efficiency of the Sienna is less than what is advertised?
ОА. Но : и
В. Но : и
С. Но : и
DD. Hо : и < 21.63 vs. H, :и> 21.63
— 22 vs. Hа:
+ 22
22 vs. H, : u < 22
a
22 vs. Ha : и> 22
2. What conditions must be met if we want to perform a hypothesis test and answer the question of the management? Select all that apply:
A. np > 10 and n(1 – p) > 10
|B. The observations are independent.
C. Population data must be nearly normal or the sample size must be at least 30.
D. There must be at least 3 levels of the categorical variable.
3. Assuming the conditions for the hypothesis test are met, find the test statistic and the p-value.
test statistic =
p-value =
Expert Solution
This question has been solved!
Explore an expertly crafted, step-by-step solution for a thorough understanding of key concepts.

This is a popular solution!

Trending now
This is a popular solution!

Step by step
Solved in 2 steps with 1 images

Knowledge Booster


Learn more about
Need a deep-dive on the concept behind this application? Look no further. Learn more about this topic, statistics and related others by exploring similar questions and additional content below.Recommended textbooks for you
Holt Mcdougal Larson Pre-algebra: Student Edition…
Algebra
ISBN:
9780547587776
Author:
HOLT MCDOUGAL
Publisher:
HOLT MCDOUGAL

Glencoe Algebra 1, Student Edition, 9780079039897…
Algebra
ISBN:
9780079039897
Author:
Carter
Publisher:
McGraw Hill

Linear Algebra: A Modern Introduction
Algebra
ISBN:
9781285463247
Author:
David Poole
Publisher:
Cengage Learning
Holt Mcdougal Larson Pre-algebra: Student Edition…
Algebra
ISBN:
9780547587776
Author:
HOLT MCDOUGAL
Publisher:
HOLT MCDOUGAL
Glencoe Algebra 1, Student Edition, 9780079039897…
Algebra
ISBN:
9780079039897
Author:
Carter
Publisher:
McGraw Hill
Linear Algebra: A Modern Introduction
Algebra
ISBN:
9781285463247
Author:
David Poole
Publisher:
Cengage Learning

Algebra & Trigonometry with Analytic Geometry
Algebra
ISBN:
9781133382119
Author:
Swokowski
Publisher:
Cengage

Big Ideas Math A Bridge To Success Algebra 1: Stu…
Algebra
ISBN:
9781680331141
Author:
HOUGHTON MIFFLIN HARCOURT
Publisher:
Houghton Mifflin Harcourt