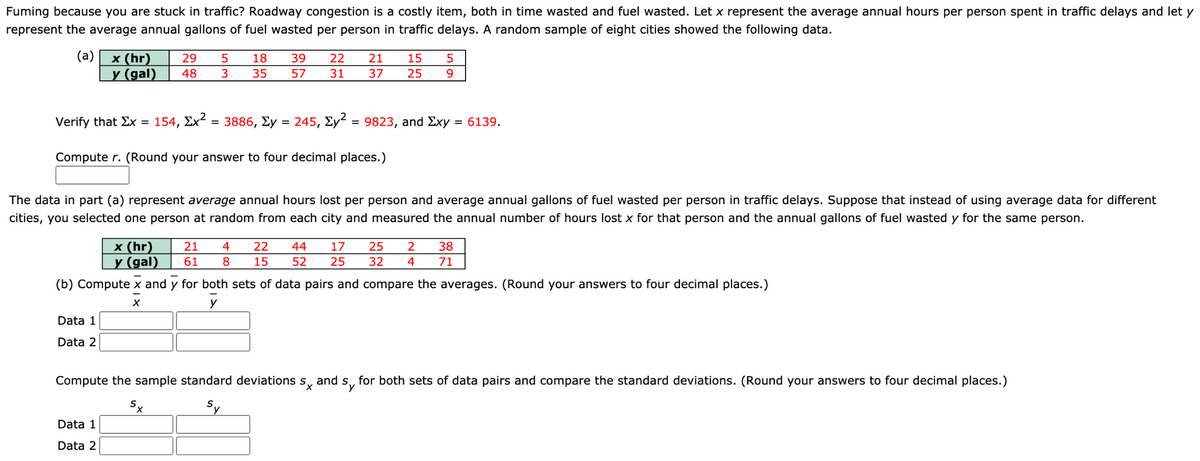
Fuming because you are stuck in traffic? Roadway congestion is a costly item, both in time wasted and fuel wasted. Let x represent the average annual hours per person spent in traffic delays and let y represent the average annual gallons of fuel wasted per person in traffic delays. A random sample of eight cities showed the following data. (a) x (hr) y (gal) 29 5 18 48 3 39 22 21 15 5 35 57 31 37 25 9 Verify that Ex = 154, Ex² = 3886, Ey = 245, Ey? = 9823, and Exy = 6139. Compute r. (Round your answer to four decimal places.) The data in part (a) represent average annual hours lost per person and average annual gallons of fuel wasted per person in traffic delays. Suppose that instead of using average data for different cities, you selected one person at random from each city and measured the annual number of hours lost x for that person and the annual gallons of fuel wasted y for the same person. x (hr) y (gal) 21 4 22 61 8 44 17 25 2 38 52 25 32 4 71 15 (b) Compute x and y for both sets of data pairs and compare the averages. (Round your answers to four decimal places.) Data 1 Data 2 Compute the sample standard deviations s, and s, for both sets of data pairs and compare the standard deviations. (Round your answers to four decimal places.) Sx Sy Data 1 Data 2
Fuming because you are stuck in traffic? Roadway congestion is a costly item, both in time wasted and fuel wasted. Let x represent the average annual hours per person spent in traffic delays and let y represent the average annual gallons of fuel wasted per person in traffic delays. A random sample of eight cities showed the following data. (a) x (hr) y (gal) 29 5 18 48 3 39 22 21 15 5 35 57 31 37 25 9 Verify that Ex = 154, Ex² = 3886, Ey = 245, Ey? = 9823, and Exy = 6139. Compute r. (Round your answer to four decimal places.) The data in part (a) represent average annual hours lost per person and average annual gallons of fuel wasted per person in traffic delays. Suppose that instead of using average data for different cities, you selected one person at random from each city and measured the annual number of hours lost x for that person and the annual gallons of fuel wasted y for the same person. x (hr) y (gal) 21 4 22 61 8 44 17 25 2 38 52 25 32 4 71 15 (b) Compute x and y for both sets of data pairs and compare the averages. (Round your answers to four decimal places.) Data 1 Data 2 Compute the sample standard deviations s, and s, for both sets of data pairs and compare the standard deviations. (Round your answers to four decimal places.) Sx Sy Data 1 Data 2

Functions and Change: A Modeling Approach to College Algebra (MindTap Course List)
6th Edition
ISBN:9781337111348
Author:Bruce Crauder, Benny Evans, Alan Noell
Publisher:Bruce Crauder, Benny Evans, Alan Noell
ChapterA: Appendix
SectionA.2: Geometric Constructions
Problem 10P: A soda can has a volume of 25 cubic inches. Let x denote its radius and h its height, both in...

Related questions

Question
Transcribed Image Text:Fuming because you are stuck in traffic? Roadway congestion is a costly item, both in time wasted and fuel wasted. Let x represent the average annual hours per person spent in traffic delays and let y
represent the average annual gallons of fuel wasted per person in traffic delays. A random sample of eight cities showed the following data.
(а)
x (hr)
у (gal)
29
18
39
22
21
15
5
48
35
57
31
37
25
Verify that Ex = 154, Ex² = 3886, Ey = 245, Ey² = 9823, and Exy
= 6139.
Compute r. (Round your answer to four decimal places.)
The data in part (a) represent average annual hours lost per person and average annual gallons of fuel wasted per person in traffic delays. Suppose that instead of using average data for different
cities, you selected one person at random from each city and measured the annual number of hours lost x for that person and the annual gallons of fuel wasted y for the same person.
x (hr)
y (gal)
21
4
22
44
17
25
38
61
8
15
52
25
32
4
71
(b) Compute x and y for both sets of data pairs and compare the averages. (Round your answers to four decimal places.)
y
Data 1
Data 2
Compute the sample standard deviations s,
and s, for both sets of data pairs and compare the standard deviations. (Round your answers to four decimal places.)
Ру
Sx
Sy
Data 1
Data 2
Expert Solution
This question has been solved!
Explore an expertly crafted, step-by-step solution for a thorough understanding of key concepts.

This is a popular solution!

Trending now
This is a popular solution!

Step by step
Solved in 7 steps with 9 images

Knowledge Booster


Learn more about
Need a deep-dive on the concept behind this application? Look no further. Learn more about this topic, statistics and related others by exploring similar questions and additional content below.Recommended textbooks for you
Functions and Change: A Modeling Approach to Coll…
Algebra
ISBN:
9781337111348
Author:
Bruce Crauder, Benny Evans, Alan Noell
Publisher:
Cengage Learning

Glencoe Algebra 1, Student Edition, 9780079039897…
Algebra
ISBN:
9780079039897
Author:
Carter
Publisher:
McGraw Hill
Functions and Change: A Modeling Approach to Coll…
Algebra
ISBN:
9781337111348
Author:
Bruce Crauder, Benny Evans, Alan Noell
Publisher:
Cengage Learning
Glencoe Algebra 1, Student Edition, 9780079039897…
Algebra
ISBN:
9780079039897
Author:
Carter
Publisher:
McGraw Hill