Gadabout Tour Company gave bus tours last summer. The tour director noted the number of people served by each of the 48 tours. The smallest number of people served was 50, and the largest was 57. The table gives the mean, median, range, and interquartile range (IQR) of the Mean Median Range IOR Summary values data set. 53.5 53.5 |(a) Select the best description of center for the data set. (b) Select the best description of spread for the data set. O Based on the range, we see that the "average" number of people served was about 7. OThe difference between the largest and smallest number of people served is 48. (This is the number of tours given.) O Based on the IQR, we see that the "average" number of OThe difference between the largest and smallest number of people served is 7. (This is the range.) people served was about 4. O Based on the mean and median, we see that the "average" number of people served was about 53 or 54. OThe difference between the largest and smallest number of people served is 53.5. (This is the mean.) (c) Select the graph with the shape that best fits the summary values. OGraph 1 (The data set is symmetric.) OGraph 2 (The data set is not symmetric.) s1 52 53 54 s5 56 57 Number of people served s0 51 s2 s3 54 55 Number of people served 50 Number of tours Number of tours
Gadabout Tour Company gave bus tours last summer. The tour director noted the number of people served by each of the 48 tours. The smallest number of people served was 50, and the largest was 57. The table gives the mean, median, range, and interquartile range (IQR) of the Mean Median Range IOR Summary values data set. 53.5 53.5 |(a) Select the best description of center for the data set. (b) Select the best description of spread for the data set. O Based on the range, we see that the "average" number of people served was about 7. OThe difference between the largest and smallest number of people served is 48. (This is the number of tours given.) O Based on the IQR, we see that the "average" number of OThe difference between the largest and smallest number of people served is 7. (This is the range.) people served was about 4. O Based on the mean and median, we see that the "average" number of people served was about 53 or 54. OThe difference between the largest and smallest number of people served is 53.5. (This is the mean.) (c) Select the graph with the shape that best fits the summary values. OGraph 1 (The data set is symmetric.) OGraph 2 (The data set is not symmetric.) s1 52 53 54 s5 56 57 Number of people served s0 51 s2 s3 54 55 Number of people served 50 Number of tours Number of tours

Glencoe Algebra 1, Student Edition, 9780079039897, 0079039898, 2018
18th Edition
ISBN:9780079039897
Author:Carter
Publisher:Carter
Chapter10: Statistics
Section10.4: Distributions Of Data
Problem 19PFA

Related questions
Question
Transcribed Image Text:Español
8.
9
10
11
12
13
14
15
16
17
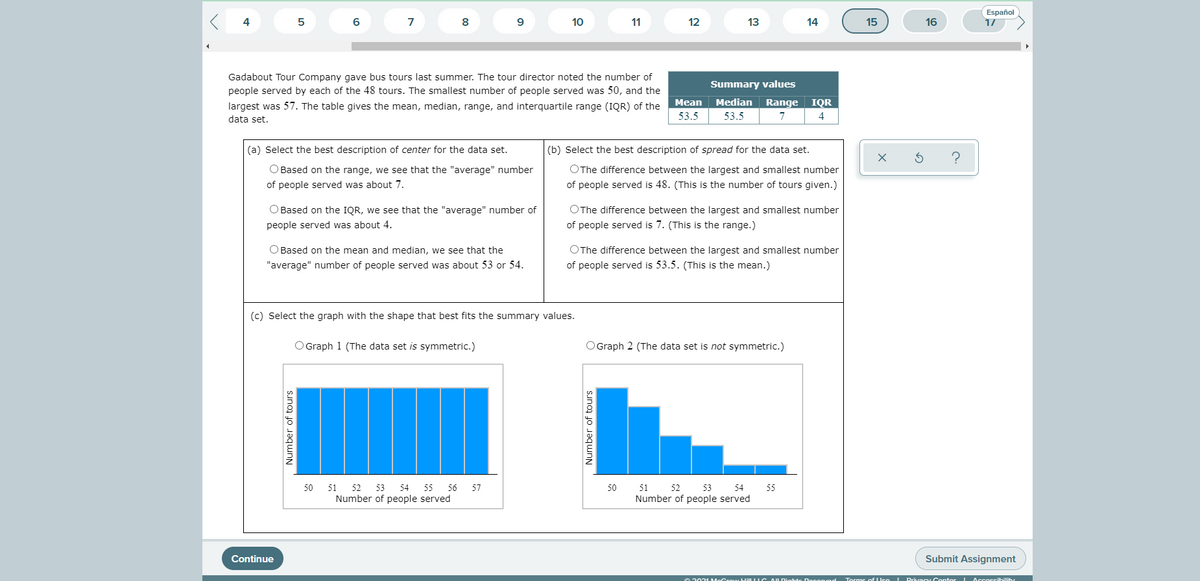
Gadabout Tour Company gave bus tours last summer. The tour director noted the number of
Summary values
people served by each of the 48 tours. The smallest number of people served was 50, and the
largest was 57. The table gives the mean, median, range, and interquartile range (IQR) of the
Мean
Median Range
IQR
data set.
53.5
53.5
7
4
(a) Select the best description of center for the data set.
(b) Select the best description of spread for the data set.
O Based on the range, we see that the "average" number
OThe difference between the largest and smallest number
of people served is 48. (This is the number of tours given.)
of people served was about 7.
O Based on the IQR, we see that the "average" number of
OThe difference between the largest and smallest number
people served was about 4.
of people served is 7. (This is the range.)
O Based on the mean and median, we see that the
OThe difference between the largest and smallest number
"average" number of people served was about 53 or 54.
of people served is 53.5. (This is the mean.)
(c) Select the graph with the shape that best fits the summary values.
O Graph 1 (The data set is symmetric.)
OGraph 2 (The data set is not symmetric.)
50 51 52 53 54 55
56
57
50
51
52
53
54
55
Number of people served
Number of people served
Continue
Submit Assignment
A202 McGro ur Hil IG AU Dights Docon od
Torme of Uso I Privacy Conter AccoFribilih
Number of tours
Number of tours
Expert Solution
This question has been solved!
Explore an expertly crafted, step-by-step solution for a thorough understanding of key concepts.

This is a popular solution!

Trending now
This is a popular solution!

Step by step
Solved in 2 steps

Recommended textbooks for you
Glencoe Algebra 1, Student Edition, 9780079039897…
Algebra
ISBN:
9780079039897
Author:
Carter
Publisher:
McGraw Hill
Glencoe Algebra 1, Student Edition, 9780079039897…
Algebra
ISBN:
9780079039897
Author:
Carter
Publisher:
McGraw Hill