Gender Weight Height Age Blood Type Female 50 170 21 O a Male 80 175 20 A Female 60 180 21 O Male 70 180 20 B 6 Female 70 165 22 A Female 60 170 23 AB Female 60 150 19 AB 9. Male 80 170 24 O 10 Female 50 170 21 O 11 Female 80 170 30 O 12 Male 60 185 23 AB 13 Male 60 150 20 B 14 Female 100 180 23 AB 15 Male 60 190 24 O 16 Female 50 160 20 A 17 Male 70 170 21 AB 18 Male 76 180 23 O 19 Male 80 190 25 O 20 Male 50 160 19 B 21 Male 60 180 20 AB 22 Male 80 170 21 B 23 Male 70 170 20 O 24 Male 60 180 20 B 25 Male 70 180 22 B 26 Male 70 180 22 A 27 Male 70 170 21 A 28 Female 50 160 22 O 29 Male 60 180 21 O a0 Male 70 150 19 B 31 Male 70 180 21 AB
Gender Weight Height Age Blood Type Female 50 170 21 O a Male 80 175 20 A Female 60 180 21 O Male 70 180 20 B 6 Female 70 165 22 A Female 60 170 23 AB Female 60 150 19 AB 9. Male 80 170 24 O 10 Female 50 170 21 O 11 Female 80 170 30 O 12 Male 60 185 23 AB 13 Male 60 150 20 B 14 Female 100 180 23 AB 15 Male 60 190 24 O 16 Female 50 160 20 A 17 Male 70 170 21 AB 18 Male 76 180 23 O 19 Male 80 190 25 O 20 Male 50 160 19 B 21 Male 60 180 20 AB 22 Male 80 170 21 B 23 Male 70 170 20 O 24 Male 60 180 20 B 25 Male 70 180 22 B 26 Male 70 180 22 A 27 Male 70 170 21 A 28 Female 50 160 22 O 29 Male 60 180 21 O a0 Male 70 150 19 B 31 Male 70 180 21 AB

Chapter8: Sequences, Series,and Probability
Section8.7: Probability
Problem 4ECP: Show that the probability of drawing a club at random from a standard deck of 52 playing cards is...

Related questions
Topic Video
Question
100%
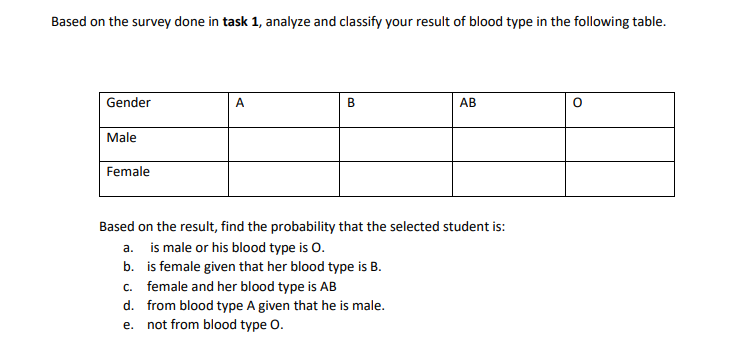
Transcribed Image Text:Based on the survey done in task 1, analyze and classify your result of blood type in the following table.
Gender
A
B
АВ
Male
Female
Based on the result, find the probability that the selected student is:
a. is male or his blood type is O.
b. is female given that her blood type is B.
c. female and her blood type is AB
d. from blood type A given that he is male.
not from blood type O.
е.
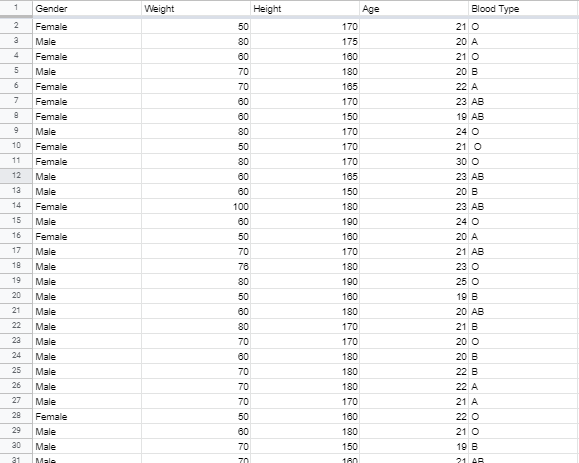
Transcribed Image Text:Gender
Weight
Height.
Age
Blood Type
2
Female
50
170
21 O
a
Male
80
175
20 A
Female
60
160
21 O
5
Male
70
180
20 B
Female
70
165
22 A
Female
60
170
23 AB
Female
60
150
19 AB
9
Male
80
170
24 O
10
Female
50
170
21 O
11
Female
80
170
30 O
12
Male
60
165
23 AB
13
Male
60
150
20 B
14
Female
100
180
23 AB
15
Male
60
190
24 O
16
Female
50
160
20 A
17
Male
70
170
21 AB
18
Male
76
180
23 O
19
Male
80
190
25 O
20
Male
50
160
19 B
21
Male
60
180
20 AB
22
Male
80
170
21 B
23
Male
70
170
20 O
24
Male
60
180
20 B
25
Male
70
180
22 B
26
Male
70
180
22 A
27
Male
70
170
21 A
28
Female
50
160
22 O
29
Male
60
180
21 O
a0
Male
70
150
19 B
31
Male
70
160
21 AB
Expert Solution
This question has been solved!
Explore an expertly crafted, step-by-step solution for a thorough understanding of key concepts.

Step by step
Solved in 2 steps

Knowledge Booster


Learn more about
Need a deep-dive on the concept behind this application? Look no further. Learn more about this topic, statistics and related others by exploring similar questions and additional content below.Recommended textbooks for you