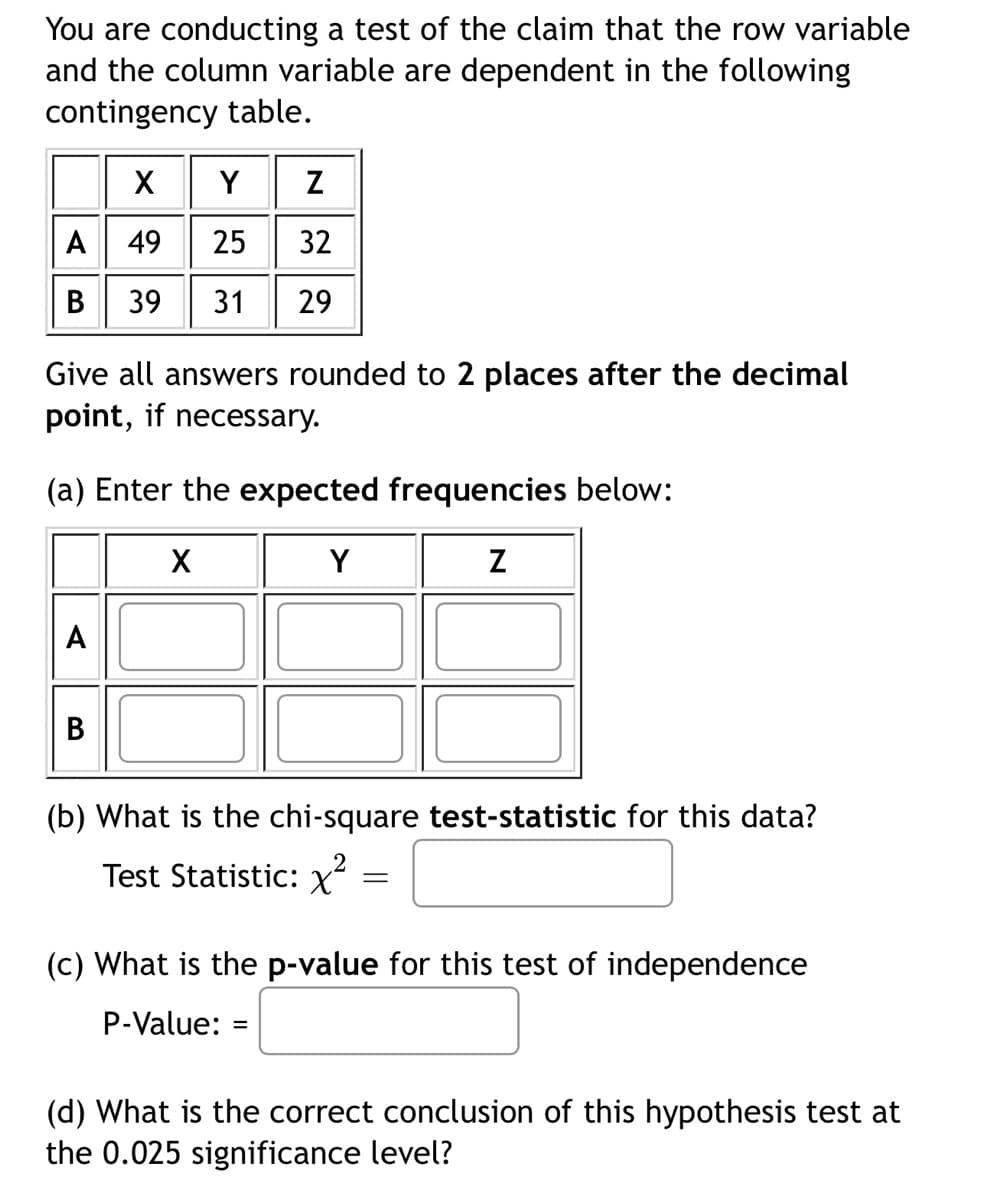
Give all answers rounded to 2 places after the decimal point, if necessary. (a) Enter the expected frequencies below: X Y Z A B (b) What is the chi-square test-statistic for this data? Test Statistic: x² = (c) What is the p-value for this test of independence


Q: Show your solutions and draw the curves for the word problems. II. Word Problems. 2. The average…
A: Given that mean =70 , s.d =8 ,n =500
Q: Beth wants to determine a 99 percent confidence interval for the true proportion p of high school…
A:
Q: Q1:Let p equal the proportion of drivers who use a seat belt in a country that does not have a…
A:
Q: The number of pizzas consumed per month by university students is normally distributed with a mean…
A:
Q: generating two symbols, dots and dashes. We observed that the dots were twice as likely to occur as…
A:
Q: Find the PDF fy () in the following cases: (A) Y=VX (B) Y = In(X)
A: Given, f(x)=e-x x≥0 (A) y=x dydx=12x⇒dxdy=2x let g(y) be the pdf of y,…
Q: If a population consisted of 75,000 people, surveying 750 people from the population could result in…
A: The point estimate is defined as " The value of a sample statistic that is used to estimate the…
Q: Consider now a different joint probability density function for X and Y, namely | 12ye-3x-2y² |0 if…
A:
Q: (c) Assume the following respective probabilities for the posi- tions of the two loads: P(W, at B) =…
A:
Q: A Markov chain Xo, X1, X2, ... has the transition probability matrix |0.6 0.3 0.1|| P = 0.3 0.3 0.4…
A:
Q: An 8-sided die with faces labeled 1 to 8 will be rolled once. The 8 possible outcomes are listed…
A:
Q: 12. Let a random variable X has a geometric distribution with p.d.f. f(x) = pq*", k =1,2,3,. Show…
A:
Q: The relationship between energy consumption and household income was studied, yielding the following…
A: We have given that, Energy consumption (Y) :- 1.8, 3.0, 4.8, 5.0, 6.5, 7.0, 9.0, 9.1 Household…
Q: Eight balls numbered 1 to 8 are placed in a bag. Some of the balls are grey and some are white. The…
A:
Q: Determine the quartiles and thé median for the following table : Income No. of Persons c.f. Below…
A:
Q: Student # 1 Pre-test Post-test 1 Post-test 2 91 89 88 2 88 89 90 3 92 93 95 4 86 82 85 5 86 89 92 6…
A: Given the data of a class of ten students pre-test, post test 1 and post test 2 performance as…
Q: What are the hypotheses in making an academic services as your business?
A: Hypothesis: It is the statement or an assumption regarding a population that is based on the sample…
Q: For which sample size (n) and sample proportion (p) can a normal curve be used to approximate the…
A: Given For which sample size (n) and sample proportion (p) can a normal curve be used to approximate…
Q: A probability mass function for a particular random variable y having monnegative integer values is…
A:
Q: The average raintall, recorded to the nearest hundredth of a centimeter, in New York City, for the…
A: (1) Let X be the random variable from normal distribution with mean (μ) = 9.22 and standard…
Q: WFC Average 0.65% 10.26% StDev. Min -28.99% Max 27.51% 25. Based on the table above, what is the…
A: The average and standard deviation of a normal distribution is 0.65% and 10.26%. The probability of…
Q: Q2: suppose that X,., X, a random sample of size n from the normal distribution N(u,02), where the…
A: Given: Null Hypothesis H0:σ2=σ02 Alternative Hypothesis H1:σ2>σ02 The critical region is defined…
Q: 1) Suppose Z-N(0,1). Find the following (round all answ a) P(Z1.65) d) Find Z that is the highest…
A:
Q: Consider the data below. Three random samples in different cities were selected. Water use per…
A: There are 3 independent samples which are city 1, city 2 and city 3. We have to test whether samples…
Q: 2. Professor Fagan teaches Monday-Friday (i.e., 5 days of the week), and suppose that with…
A: Given Information: Professor teaches 5 days a week i.e., Monday to Friday. Probability that he is…
Q: n regards to "Go to Stat > Regression > Regression > Fit a regression model." where is stat?
A: It is given table representing the ratings and the number of minutes on hold for 10 customers.…
Q: If a dice is thrown twice, find the probability of getting two 5’
A:
Q: State whether the following are qualitative or quantitative. a) The speed of the roller coasters at…
A: Quantitative data can be measured numerically. But qualitative data cannot be measured numerically.
Q: An insurance agent sells the policies to 20 persons having same age and in good health. Based on the…
A: As per our guidelines we are supposed to answer only 3 subpart of any questions so i am solving…
Q: An Internet Service Provider opens 10 new accounts per day, on average. Let X be a random variable…
A:
Q: Q/ The average number of collisions occurring in a week during the summer months at a particular…
A: As per our guidelines we are supposed to answer only 3 sub-parts of any questions so i am solving…
Q: B. Find the value of z so that the area under the standard normal curve from 0 to z is…
A:
Q: correctly
A: Expected value = Expected win - investment Here, investment is $1 and expected win can be…
Q: How many seating arrangements can be formed by seating Alyssa, Bea, Kat, Dy, Isabel in a row:
A: Seating arrangement questions are the most common problem types in all entrance exams containing the…
Q: 5 points) A man claims to have extrasensory perception (ESP). As a test, a fair coin is flipped 21…
A: Given: Fair coin is flipped 21 times. n = 21 p = 0.50 x = 15
Q: spinner with 5 equally sized slices has 2 yellow slices, 2 red slices, and 1 blue slice. Raina spun…
A: Given Total number of spins=25
Q: During a gift exchange, ten different gifts ars labeled 1-10 Each person tokas a turn saleeting a…
A:
Q: 9. A lot consists of 25 batteries, for which 5 of them are defective. Three batteries are randomly…
A: Given: A lot consists of 25 batteries 5 of them are defectives 3 batteries are randomly selected…
Q: Given the function below, solve for the following: ‚ −2 < y < 4 F(y) = 0, elsewhere a. Verify that…
A:
Q: Question 4: Using Excel, conduct a NHST to determine whether there is a correlation in the…
A: Given Information: Independent variable X is Trump's share of popular vote Dependent variable Y is…
Q: Assuming that the ratio is a normal random variable, construct a probability plot and observe if the…
A: The normal probability plot is the standard method of testing if the data deviates substantially…
Q: Suppose IQ scores were obtained for 20 randomly selected sets of twins, The 20 pairs of measurements…
A: Solution
Q: compute every total probability.
A: We are given that CDF of X & Y are: FX,Y(x,y)=0x<-2 or y<-538-2≤x<2 and -5≤y<312x≥2…
Q: Regardess of the kind of workout a gym goer does, the mean time spent on the treadmill is 45…
A:
Q: Use normal approximation to estimate the probability of getting at most 47 girls in 100 births.…
A:
Q: Q/ The quality control department examines all the products returned to a store by customers. An…
A: Given: 5% of the returned products are defective and not repairable. 45% are defective but…
Q: Find P(x)= E(X), E(X²) for 5 ( ²² ) [2X-X²] {1+) other the ocx cz
A: Given function isp(x)={342x-x2 0<x<20 otherwise
Q: (c) What is the probability that she planted rutabagas but not asparagus in that bed? (d) What is…
A: Formulae: P(A/B)=P(A∩B)P(B) P(A∪B)=P(A)+P(B)-P(A∩B) P(A-∩B)= P(B)-P(A∩B)
Q: Part B: Binomial Distribution Use the Binomial Distribution calculator at…
A:


Trending now
This is a popular solution!

Step by step
Solved in 2 steps with 2 images

- You are conducting a test of the claim that the row variable and the column variable are dependent in the following contingency table. X Y Z A 67 6 30 B 66 20 29 Give all answers rounded to 3 places after the decimal point, if necessary. (a) Enter the expected frequencies below: X Y Z A B (b) What is the chi-square test-statistic for this data? Test Statistic: χ2=χ2= (c) What is the critical value for this test of independence when using a significance level of αα = 0.05? Critical Value: χ2=χ2= (d) What is the correct conclusion of this hypothesis test at the 0.05 significance level? There is sufficient evidence to warrant rejection of the claim that the row and column variables are dependent. There is not sufficient evidence to warrant rejection of the claim that the row and column variables are dependent. There is not sufficient evidence to support the claim that the row and column variables are dependent. There is…You are conducting a test of the claim that the row variable and the column variable are dependent in the following contingency table. X Y Z A 29 50 31 B 33 46 22 Give all answers rounded to 3 places after the decimal point, if necessary. (a) Enter the expected frequencies below: X Y Z A B (b) What is the chi-square test-statistic for this data? Test Statistic: χ2=χ2= (c) What is the critical value for this test of independence when using a significance level of αα = 0.10? Critical Value: χ2=χ2= (d) What is the correct conclusion of this hypothesis test at the 0.10 significance level? There is sufficient evidence to warrant rejection of the claim that the row and column variables are dependent. There is not sufficient evidence to warrant rejection of the claim that the row and column variables are dependent. There is not sufficient evidence to support the claim that the row and column variables are dependent. There is…You are conducting a test of the claim that the row variable and the column variable are dependent in the following contingency table. X Y Z A 25 15 26 B 12 53 42 Give all answers rounded to 3 places after the decimal point, if necessary.(a) Enter the expected frequencies below: X Y Z A B b) What is the chi-square test-statistic for this data? Test Statistic: χ2= (c) What is the critical value for this test of independence when using a significance level of α= 0.05? Critical Value: χ2=(d) What is the correct conclusion of this hypothesis test at the 0.05 significance level? There is not sufficient evidence to support the claim that the row and column variables are dependent. There is sufficient evidence to warrant rejection of the claim that the row and column variables are dependent. There is sufficient evidence to support the claim that the row and column variables are dependent. There is not sufficient evidence to warrant rejection of…
- You are conducting a test of the claim that the row variable and the column variable are dependent in the following contingency table. X Y Z A 21 39 33 B 15 47 30 Give all answers rounded to 3 places after the decimal point, if necessary. (a) Enter the expected frequencies below: X Y Z A B (b) What is the chi-square test-statistic for this data? Test Statistic: χ2=____________ (c) What is the critical value for this test of independence when using a significance level of α = 0.005? Critical Value: χ2=________ (d) What is the correct conclusion of this hypothesis test at the 0.005 significance level?___________ There is sufficient evidence to support the claim that the row and column variables are dependent. There is not sufficient evidence to warrant rejection of the claim that the row and column variables are dependent. There is sufficient evidence to warrant rejection of the claim that the row and column variables are…You are conducting a test of the claim that the row variable and the column variable are dependent in the following contingency table. X Y Z A 31 56 44 B 45 22 16 Give all answers rounded to 3 places after the decimal point, if necessary. (a) Enter the expected frequencies below: X Y Z A B (b) What is the chi-square test-statistic for this data? Test Statistic: χ2=χ2= (c) What is the critical value for this test of independence when using a significance level of αα = 0.10? Critical Value: χ2=χ2= (d) What is the correct conclusion of this hypothesis test at the 0.10 significance level? There is not sufficient evidence to support independence of the row and column variables. There is sufficient evidence to support independence of the row and column variables. There is sufficient evidence to reject independence of the row and column variables. There is not sufficient evidence to reject independence of the row and column…You are conducting a test of the claim that the row variable and the column variable are dependent in the following contingency table. X Y Z A 48 22 21 B 32 25 46 Give all answers rounded to 3 places after the decimal point, if necessary. (a) Enter the expected frequencies below: X Y Z A B (b) What is the chi-square test-statistic for this data? Test Statistic: χ2= (c) What is the critical value for this test of independence when using a significance level of α = 0.025? Critical Value: χ2=
- The least-squares regression line relating two statistical variables is given as = 24 + 5x. Compute the residual if the actual (observed) value for y is 38 when x is 2. 4 38 2a. Assuming for the moment that all coefficients are significant, please interpret the coefficients of the four independent variables in the BIG b. To determine which of the two models above is statistically superior at the .10 level, please calculate the appropriate F‐statistic.In a regression based on 30 annual observations, U.S. farm income was related to four independent variables—grain exports, federal government subsidies, population, and a dummy variable for bad weather years. The model was fitted by least squares, resulting in a Durbin-Watson statistic of 1.29. The regression of e2i on ŷi yielded a coefficient of determination of 0.043.a. Test for heteroscedasticity.b. Test for autocorrelated errors.
